
This is the sharing of the 88th Quantitative Small Lecture of Xingbuxing
Author | Xing can't
There are such a group of people who are the backbone of the stock market, occupying half of the market value of A-shares in circulation .
They are good at fighting protracted battles at the height of 3000 points, and they dare to fight hand-to-hand with opponents whose funds far exceed their own .

This is our protagonist today, the new force in the A-share market: retail investors.
01
Retail investors buy in reverse
|
1 |
retail legend |
In the A-share market, retail investors are the real heroes of the country.
However, retail investors have always been ridiculed and regarded as synonymous with leeks . There is even a saying that spreads widely: retail investors buy against the sea, and villas rely on the sea .
It is worth mentioning that the popular sayings in the market have always been the source of inspiration for our quantitative strategy development.

This article will try to start from this saying and build a quantitative strategy to see whether retail investors buy it backwards, villas rely on the sea, or follow retail investors to make a fortune every day.
|
2 |
Copy retail homework |
I once said in "The Magical Use of Northbound Funds to Find the Buying and Selling Points of the Market, and Follow the Operation 4 Times in 6 Years " that the happiest thing in investing is that someone has always been right, and we can just copy it, such as northbound funds, social security funds, etc.
The second happiest thing is that someone has been wrong all the time, and I can do it the other way around. He buys me and sells, and he sells me to buy.

From experience, isn't retail investors exactly such a role? So this time, we will try to follow the scumbags, do it in reverse, and copy a wave of homework in reverse.
02
Dragon Tiger List Exploration
|
1 |
Retail base camp |
In order to realize the above strategy, it is necessary to have the corresponding data of the retail operation.
Data is crucial to quantitative investment . Without data, it is difficult for a clever woman to cook without rice.
I found a very suitable data to verify the conjecture, and this data is related to the brokerage of Oriental Fortune .
As the country's largest Internet brokerage, Dongcai's main customer group is retail investors .
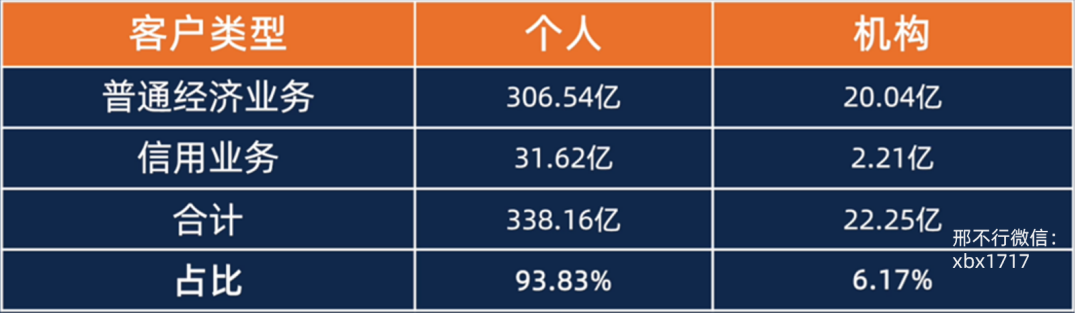
After opening an account in Dongcai, no matter where you are, it will be attributed to its several business offices in Lhasa .
Retail base camp
Since most of the trading volume of these branches comes from retail investors, they are also known as retail investor base camps .
It should be noted that these business departments are also frequent customers of the Dragon Tiger List .
|
2 |
Introduction to Dragon Tiger List |
Some students may not know what the dragon and tiger list is, here is a brief introduction.
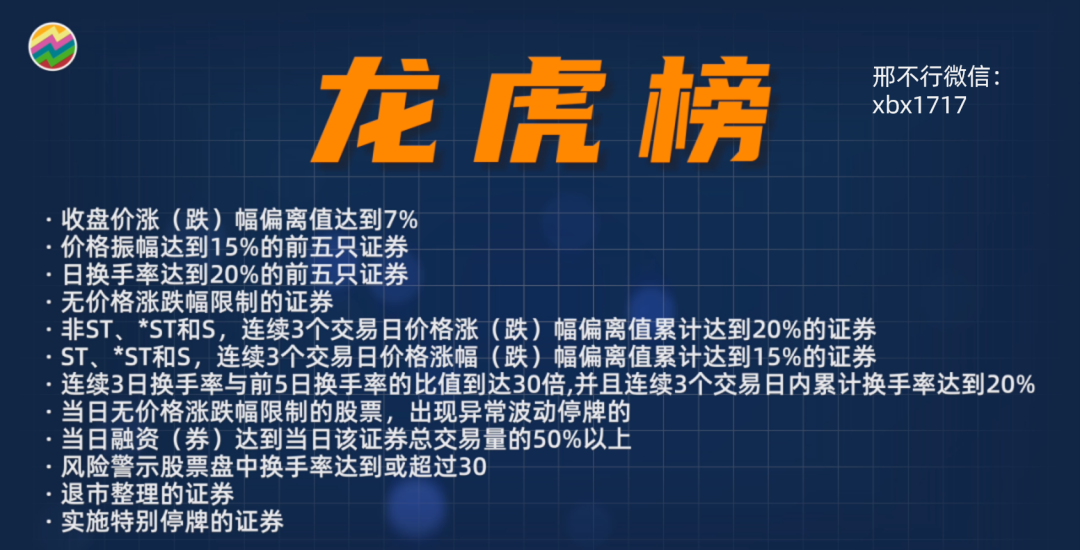
Every trading day, there will be abnormal fluctuations in the price of some stocks . As long as the stocks meet any of the conditions in the figure below, the exchange will list them and put them on a list. This list is the Dragon Tiger List.
|
3 |
Dragon Tiger list performance |
As long as it is on the Dragon and Tiger List, the exchange will announce the sales offices that are active in buying and selling the stock .
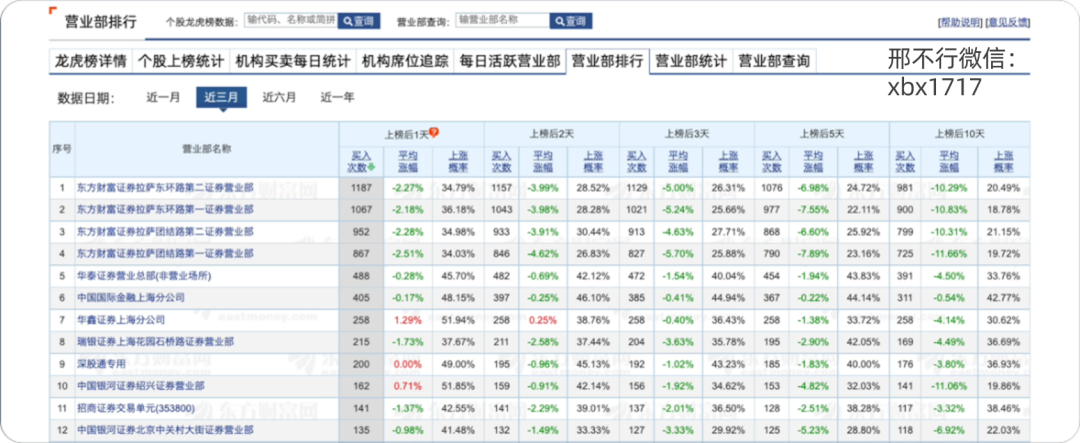
If you find the historical data of the Dragon Tiger List, you will find that the Donghuan First Securities Sales Department of Dongcai is often on the list .
I also found a financial website , which counted the future performance of the relevant stocks after the sales department was listed .
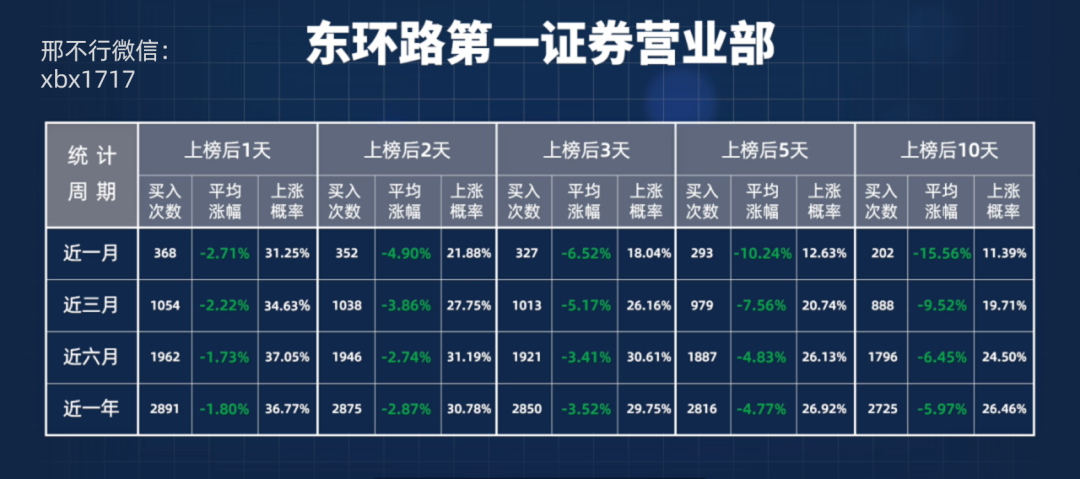
After East Ring Road was on the list, the results were dismal
If you look closely at the table above, you can find that the stocks related to the sales department are likely to lose money after being listed, and the longer you are on the list , the more losses you will lose .
In addition to the first business department of Donghuan Road, the other three business departments of Dongcai also have corresponding data, and the performance is equally appalling .
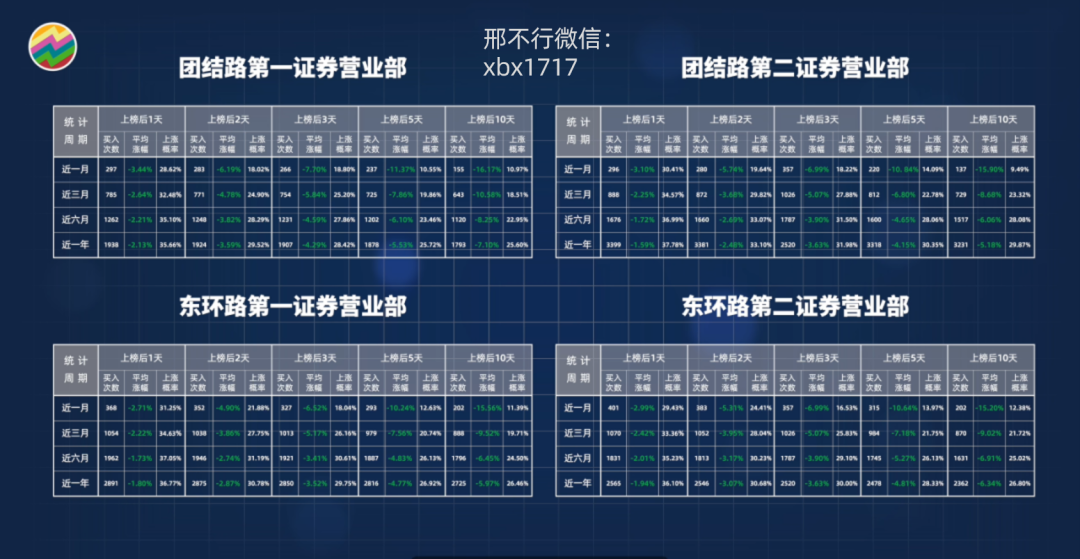
What's even more magical is that this statistic is still from the official website of Dongcai, so I slap myself in the face.
Interested students can scan the QR code below or add me on WeChat xbx1717.

I will send you the relevant website, so you can go and have a look.
Closer to home, we can preliminarily determine that the operation of retail investors is really not good through the data of the Dragon Tiger List.
However, this data has certain limitations. After all, the number of stocks that can be listed on the Dragon and Tiger List is very limited every day, and the sales department of Dongcai cannot represent the operations of all retail investors.
If the data is not comprehensive enough, the quantitative strategy based on this data will be biased. So we need to look for other reliable data.
03
Money Flow Data
|
1 |
Money Flow Concept |
I once wrote an article that introduced the inflow and outflow data of capital that you can often see on stock trading software .
For example, institutional capital inflows, retail capital outflows , major capital inflows, and large capital outflows of a stock.

In this article, I also talked about how the capital flow data is calculated in detail. If you are interested, you can take a look.
Let me briefly state the conclusion: in fact, the capital flow data is just a simple approximate simulation . It estimates the capital inflow and outflow data related to institutions and retail investors through algorithms, rather than actually summarizing all institutions, large households, medium households, Retail investors' buying and selling data.
|
2 |
Money Flow Data |
I also helped you organize the data, including the daily opening high closing low price and capital flow data of all stocks (including delisted stocks) since their listing: such as retail purchase/sell amount, institutional purchase/sell The amount , etc., is very complete.
The data is as shown in the figure:
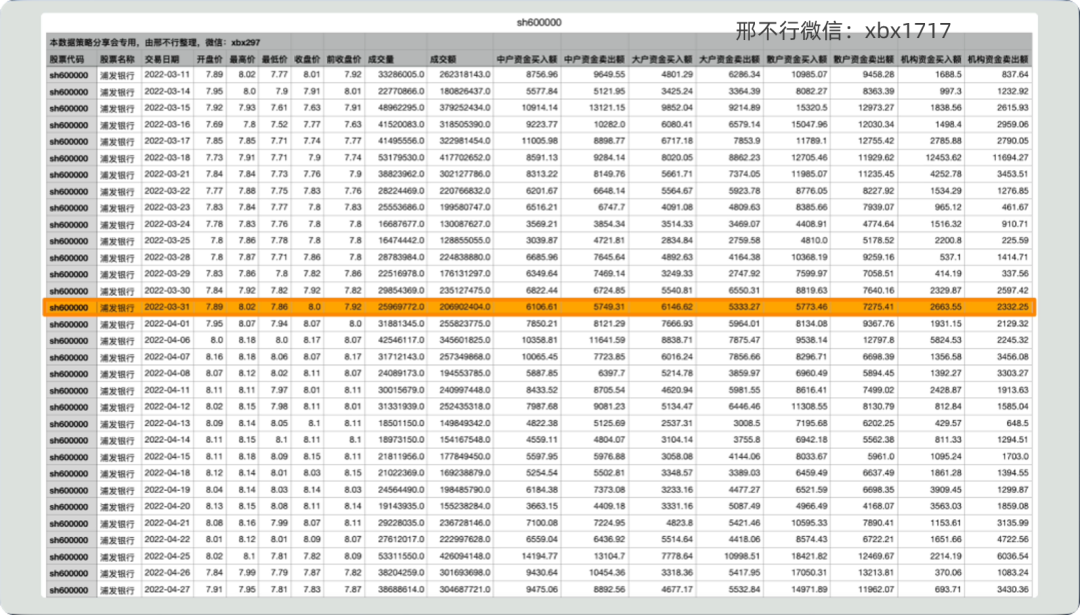
We can also look at the data this way. For example, on March 31, 2022, the turnover of Shanghai Pudong Development Bank was 206.9 million, of which retail investors bought 61.06 million, medium-sized investors bought 61.46 million, large investors bought 57.73 million, and institutions bought 26.63 million.
We can see how much retail funds played a role in SPDB's transactions that day.
If you need this data, you can scan the QR code below or add me on WeChat xbx1717, all of which can be sent to you for free.
|
3 |
retail sell signal |
Since we are going to copy the homework of retail investors in reverse, theoretically, I want to sell the stocks that retail investors collectively buy, and I want to buy stocks that retail investors collectively sell.

This is actually a long- short strategy . We can short and long at the same time, but considering that A shares cannot be free to short individual stocks at present, we can only construct a unilateral long strategy , that is, to buy stocks that retail investors sell in large quantities.
So how do we judge which stocks are sold by retail investors ?
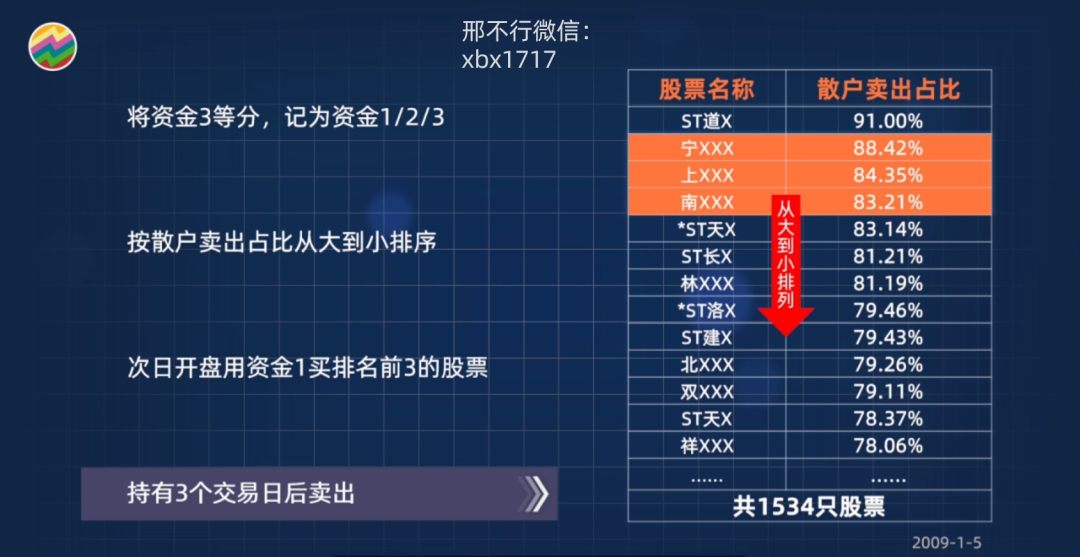
For example, on December 31, 2021, we will sort the stocks sold by retail investors from large to small to see which stocks are the most sold by retail investors on that day.
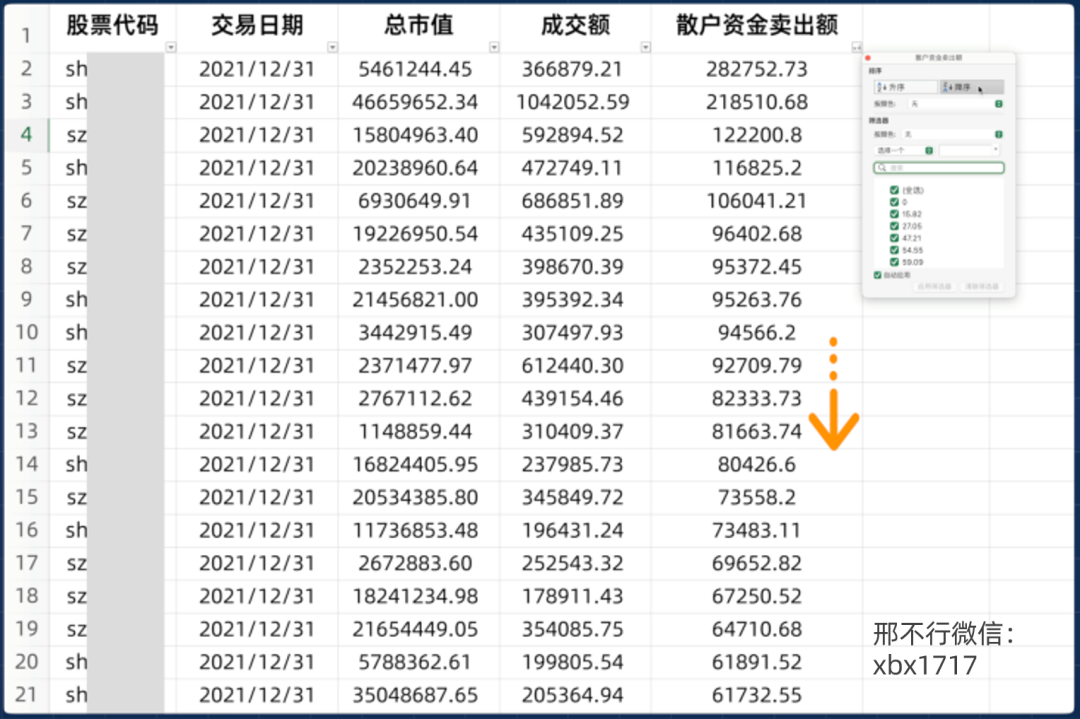
It should be noted that the market value and trading volume of stocks are divided into large and small. Large-cap stocks are naturally high in trading volume, while small-cap stocks have low trading volume.
Therefore, we cannot judge whether a certain stock has been sold by retail investors by its absolute value .
We need to look at the relative value and find the stocks with the highest proportion of retail investors' sales in the turnover. These are the ones sold by retail investors.

04
Retail Investor Performance Statistics
|
1 |
Statistics |
Based on this, we calculated the proportion of retail sales of all stocks every day , and tried to make the following table for preliminary statistics.
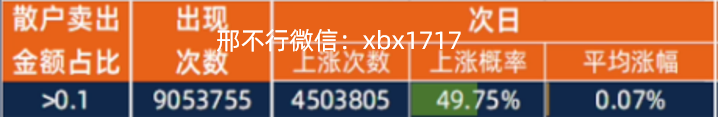
This table counts about 9.05 million times in history where retail sales account for more than 10% of the total, of which 4.5 million times rose on the next day, with a rise probability of 49.75%, and the average rise and fall. It's 0.07%, not much different from flipping a coin .

We not only look at 1 day, but also the data of the next 3 days/5 days. Of course you'll find it's the same as flipping a coin.
We can also look at greater than 20%, greater than 30%, or even greater than 90%.
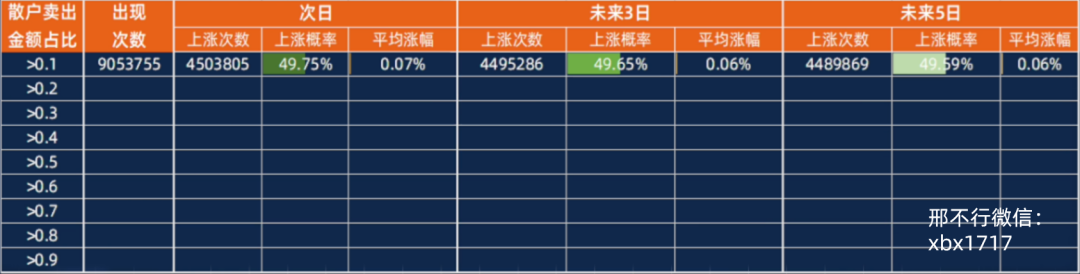
As expected, higher proportions should be more likely to show a significant predictive effect .
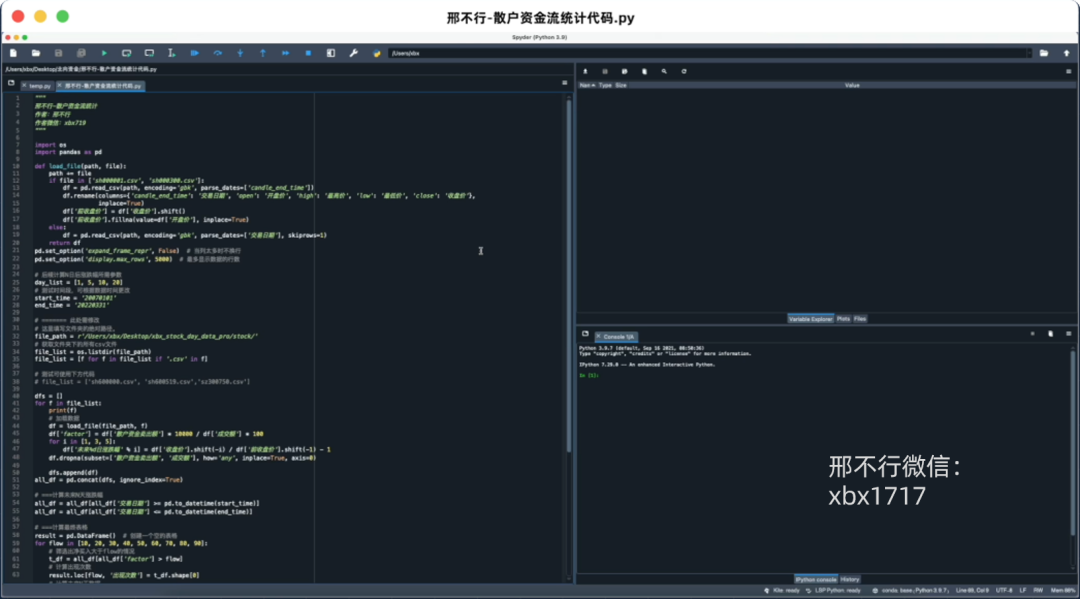
It is difficult for us to calculate the results of this table by hand, and we need to use Python programming to complete it.
If you need relevant data and codes, you can scan the QR code below or add me on WeChat xbx1717 , all of which can be sent to you directly.
|
2 |
statistical results |
The result of running the code is shown in the figure:
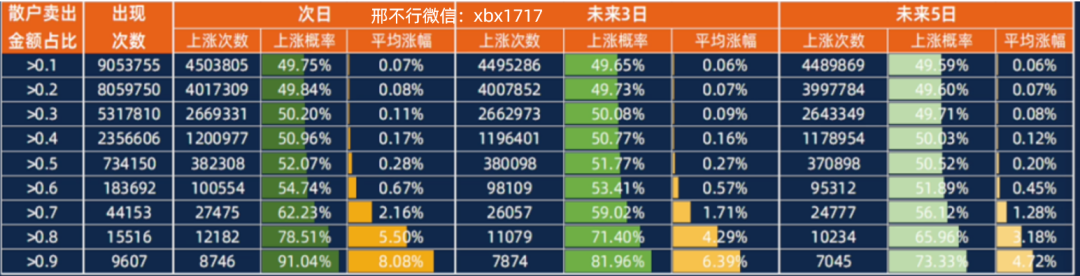
First of all, we can clearly see that the higher the proportion of retail investors' selling amount, the less the number of occurrences . For example, the proportion of more than 90% only occurred 9600 times.
And as the proportion is higher, the probability of rising in the future is also higher , and the average increase is also greater , especially when the proportion is greater than 80% and 90%, the winning rate has reached an astonishing 65%+, and the average increase is even 4 %+, 8%+.
Everyone should know that in X games, the banker can make a lot of money as long as you have a 51% win rate relative to you, and you can imagine how amazing the 60%+ win rate is.

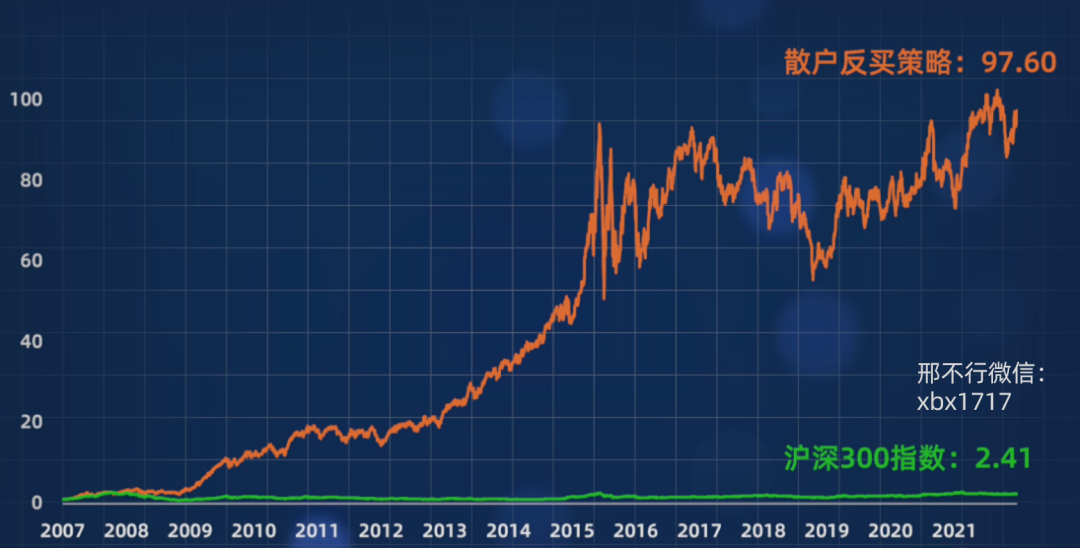
The statistical result that the higher the proportion of retail investors sold, the better the future performance of stocks, also corresponds to the saying: retail investors buy in reverse, villas rely on the sea .
|
3 |
Strategy Derivation |
So far, we have obtained a good statistical result through the analysis of the capital flow data .
But we have no way of making money from this conclusion yet. Because you have a conclusion and you don't know how to execute the transaction .
Because our quantitative strategy needs to be very precise, it will clearly tell you when to buy what stocks, how much to buy, how many positions to take, and when to sell.
We can also get the corresponding capital curve of the strategy, and see if you buy or sell according to the strategy, whether you are winning or losing.
How to convert the previous table into a clear quantitative strategy? Due to the limited space, we will talk about it in the next issue.
If you have your own ideas on the construction of this strategy, you are also welcome to scan the QR code below or add me on WeChat xbx1717 to communicate with me.
05
postscript
At the end of the article, I would like to share with you some insights on quantitative investing .
Many people have asked me how Xiaobai started to learn quantitative investment , and what books can I recommend .
My advice is to never look for this book directly.
If you look for a programming book, you will finish typing "Hello World"; if you look in a math book, you will fall asleep when you see the formula on page 7.

A better way to learn is to do real projects and learn quantitative strategies in practice .
A research report is a good quantitative practice project.
A research report is a strategy. The authors are all highly educated brokerage analysts with an annual salary of millions. All you have to do is to read the strategy research report and implement it with code.

During this period, I will not learn what, and I will not point where, and I will learn with the mentality of solving problems , and I will get twice the result with half the effort.
He has read 300 Tang poems well, and can sing even if he can't compose poems.

So where can I get research reports ?
You can scan the QR code below or add my WeChat xbx1717 , I have tens of thousands of research reports by category , and they will be updated in real time .
I will distinguish the difficulty and send it to you after the selection .
After adding me on WeChat xbx1717 , you can also exchange questions related to quantitative investment . I am busy and reply slowly, but I will reply to everything I see.
Have fun chatting, chatting with fate, a lot of quantitative data and information can be sent to you .
You can also look through the content of my circle of friends , a lot of quantitative dry goods . Some content that will not be publicly released will be said in the circle of friends.

Contact the author
