How do ordinary users evaluate the experience of a website?
In addition to meeting his functional needs, ease of use is probably the biggest evaluation factor. This unpleasantness can be simply understood as whether it is happy or not, whether it looks good or not, whether it conforms to his operating habits and so on. And the speed here is what we call performance.
Data shows that performance is directly related to a company's earnings to a certain extent.
As follows:
|
performance |
income |
|
Google delay 400ms |
Search volume dropped 0.59% |
|
Bing delay 2s |
Revenue fell 4.3% |
|
Yahoo delay 400ms |
Traffic drops by 5-9% |
|
Mozilla page opens reduced by 2.2s |
Downloads increased by 15.4% |
|
Netflix turns on Gzip |
13.25% performance improvement, 50% bandwidth reduction |
Why is performance related to revenue? Because users don’t need it if it’s slow, and if there are fewer users, the revenue will naturally drop. So it is imperative to improve performance.
So where should we improve the performance of our website? In fact, there are many factors that affect performance, which can be roughly divided into front-end performance and back-end performance. This article only discusses front-end performance , which is the speed at which the page opens from the time the user enters a URL or clicks on a link.
How should I test the performance of the front end?
1. First understand the process of web page loading
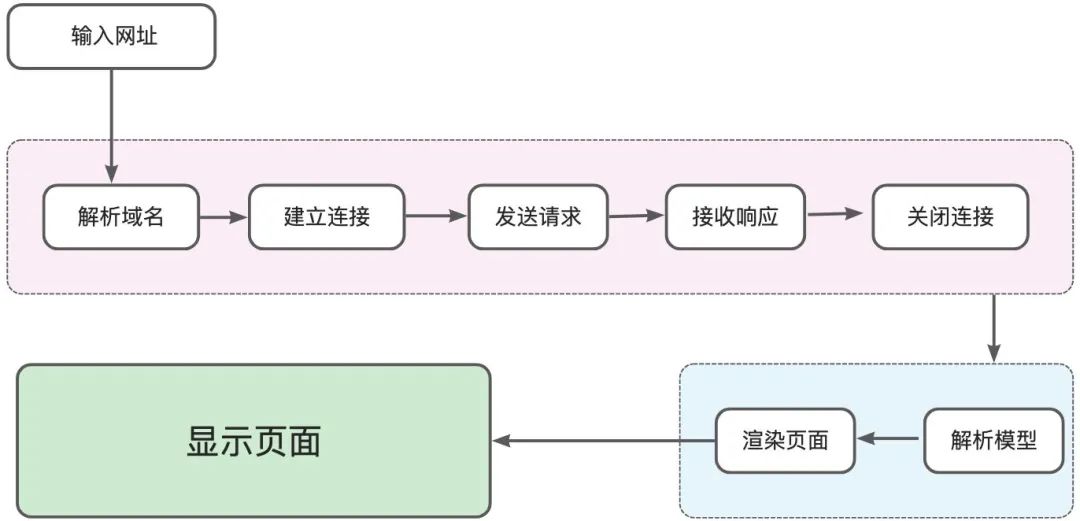
Before we talk about how to perform performance testing on the front end, we need to understand what has happened from the input of the URL to the display of the page.
The general process is:
-
Enter the URL: enter the URL in the browser or click the link (usually a domain name);
-
Resolve domain name: The browser connects to DNS (Domain Name Resolution System) to resolve the domain name to the corresponding IP address;
-
Establish a connection: Then establish a TCP network connection (three-way handshake) with the server identified by this IP address;
-
Send request: then send an HTTP request to the server;
-
Receive response: After the server processes the request, it returns the data to the client in the HTTP response;
-
Close the connection: close the TCP connection after the data is sent (wave four times);
-
Rendering the page: the browser parses the model (HTML & CSS), renders the page (layout, drawing);
-
Page display: After rendering, the page is presented to the user and is always waiting to respond to the user's operation.
As shown below:
If starting from the user-perceivable process after entering the URL, it can be roughly divided into:
-
Display white screen: from blank screen to the first screen out.
-
First Content Displayed: The page displays content for the first time.
-
Show partial content: Show partial content on the page.
-
The page is operational: All the content of the page is displayed and can be operated normally.
As shown below:

The picture is from the Internet, the content has been modified.
2. Determine which performance metrics to focus on
Knowing the page loading process, we need to formulate indicators for each process, so as to measure whether the performance is good or not.
Common metrics based on user-perceivable processes (user experience) are:
-
White screen time (FirstPaint, FP): the time from the blank screen to the first screen;
-
First Contentful Paint (FCP): The time to render the first text or image;
-
Largest Contentful Paint (LCP): The time to render the largest text or image;
-
Time To Interactive (TTI): How long it takes for a web page to provide full interactive functionality.
How to measure whether these indicators are good or not?
-
Reference to industry standards: Take industry standard indicators as a reference and align with the industry;
-
Refer to the data of competing products: take the performance indicators of competing products as a reference, and learn from the opponent;
-
Reference monitoring data: collect the user's front-end performance data as a reference;
For example, refer to the industry indicators:
|
index |
quick |
middle |
slow |
|
First Contentful Paint |
0~1.8s |
1.8~3s |
>3s |
|
First Meaningful Paint |
0~2s |
2~4s |
>4s |
|
Speed Index |
0~3.4s |
3.4~5.8s |
>5.8s |
|
First CPU Idle |
0~4.7s |
4.8~6.5s |
>6.5s |
|
Time to Interactive |
0~3.8s |
3.9~7.3s |
>7.3s |
|
Max Potential First Input Delay |
0~130ms |
130~250ms |
>250ms |
|
Total Blocking Time |
0~200ms |
200~600ms |
600ms |
|
Largest Contentful Paint |
0~2.5s |
2.5~4s |
4s |
From: https://mp.weixin.qq.com/s/-AGuUT0sPKn4pkZuP8gqLA
Of course, you should also pay attention to factors that affect performance, such as the number of page requests, image size, whether the file is compressed, whether to use CDN, etc.
From this, you can formulate the performance indicators of your own products, such as:
|
Indicator item |
Recommended/reference value |
Indicator item description |
|
|
time consuming |
finish(s) |
<5s |
The time between all HTTP requests on the page sent to the completion of the response |
|
DOMContentLoaded(s) |
<1s |
DOM tree construction complete |
|
|
Load(s) |
<3s |
page loaded |
|
|
First Contentful Paint |
<1.8s |
Measures the time it takes for a page to finish rendering on the screen from the start of loading to any part of the page's content |
|
|
Time to Interactive |
<3.8s |
Measures the time it takes for a page to start loading until the main sub-resource finishes rendering and responds to user input quickly and reliably. |
|
|
Speed Index ( page speed ) |
<3.4s |
Measures how quickly content is rendered visually during page load. |
|
|
Total Blocking Time |
<200ms |
The total blocking time for a page is the sum of the blocking time for each long task that occurs between FCP and TTI. |
|
|
Largest Contentful Paint |
<2.5s |
Reports the relative time that the largest image or text block visible in the viewable area completed rendering, based on the point in time when the page first started to load. |
|
|
Cumulative Layout Shift |
<0.1s |
Measure the largest chain of layout offset scores among all unexpected layout offsets that occur over the lifetime of the page |
|
|
page |
page requests |
<80 |
The number of all HTTP requests for the page. |
|
JS |
/ |
Control the volume and quantity. The larger the volume, the longer the loading time, and the more the quantity, the longer the network interaction will take. You can refer to the data of competing products. |
|
|
CSS |
/ |
As little as possible, you can refer to the data of peer competitors. |
|
|
picture |
<100k |
||
|
page resource |
/ |
Control the size of the resource, the larger the resource, the longer it takes to load, you can refer to the data of competing products |
|
|
CDN |
Static resources use CDN |
||
3. Choose the right test tool
The indicators of concern have been determined, let's see how to get these indicators.
1. Lighthouse: Front-end performance automated test analysis tool
Lighthouse is a web front-end performance automated test and analysis tool open sourced by Google. It is mainly used to improve the quality of web applications. We only need to provide it with a URL to be tested, and it can automatically perform some tests, and eventually generate a page performance test. , PWA (Progressive Web apps, Progressive Web Apps), Accessibility (Accessibility), Best Practices, SEO Report Checklist for reference.
We can use Lighthouse through Chrome Developer Tools, Chrome Extensions, Command Line, Node Module.
Take Chrome developer tools as an example, the usage is as follows:
STEP 1. Open the URL under test with Chrome/Edge, press F12, open the developer tools, and you can see Lighthouse.
As follows:

STEP 2. Then click【Analyze page load】to start the analysis
The report is as follows:
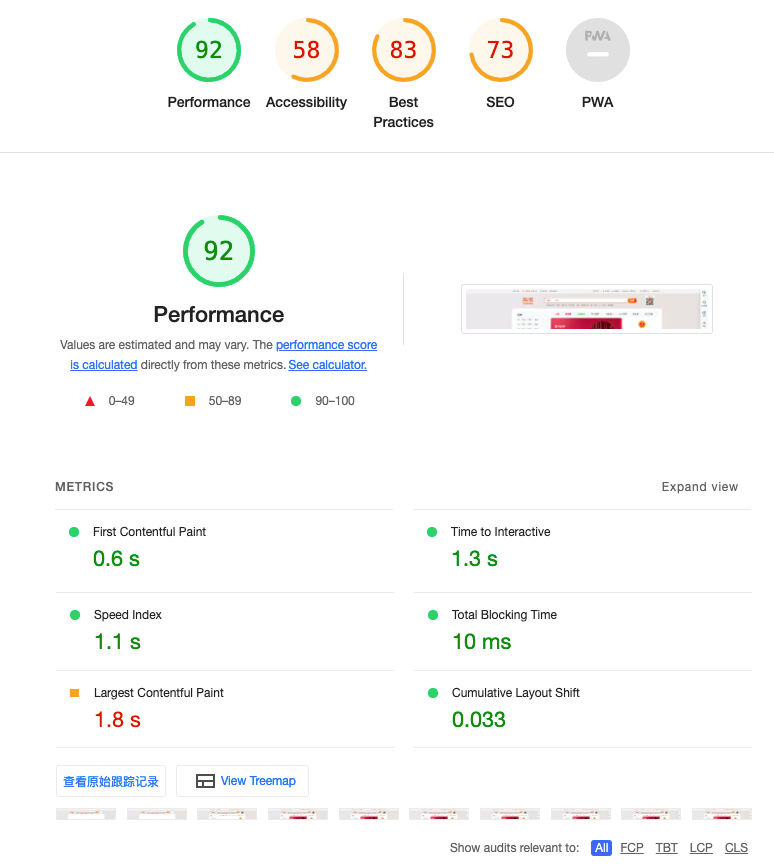
In addition to the scores and metrics in the chart above, the report also includes optimization suggestions to improve page load speed and diagnostic results for app performance.
2. Pingdom Website Speed Test: Comprehensive analysis of the reasons that affect page loading speed
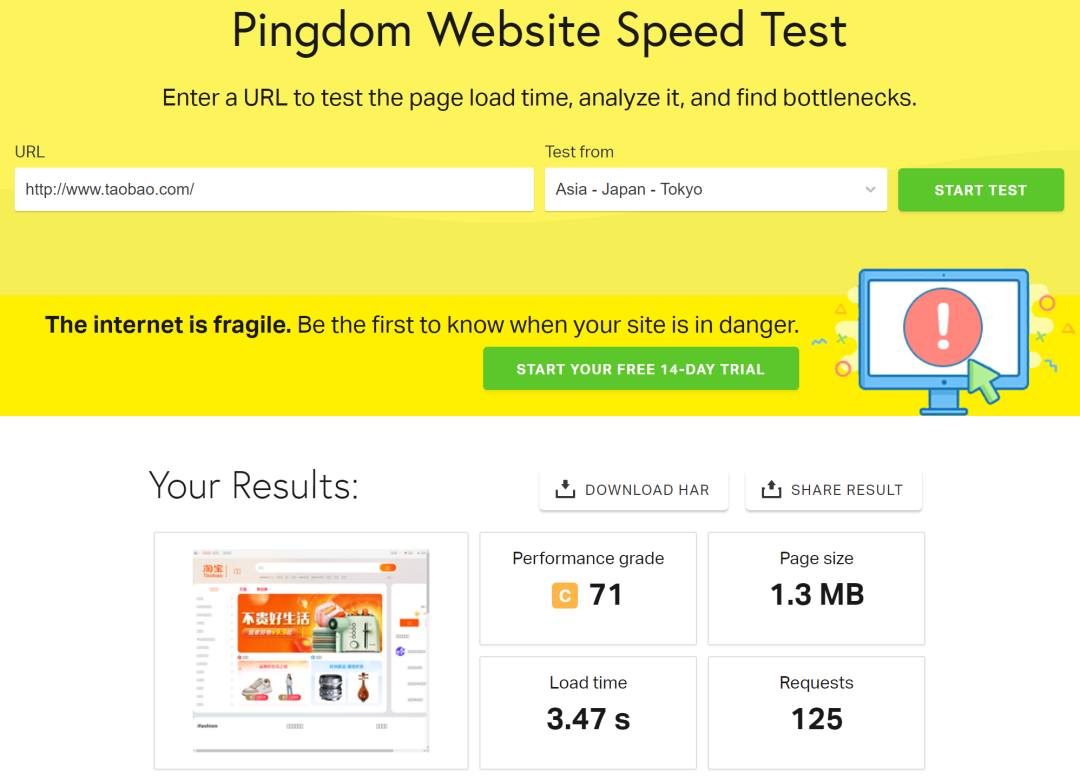
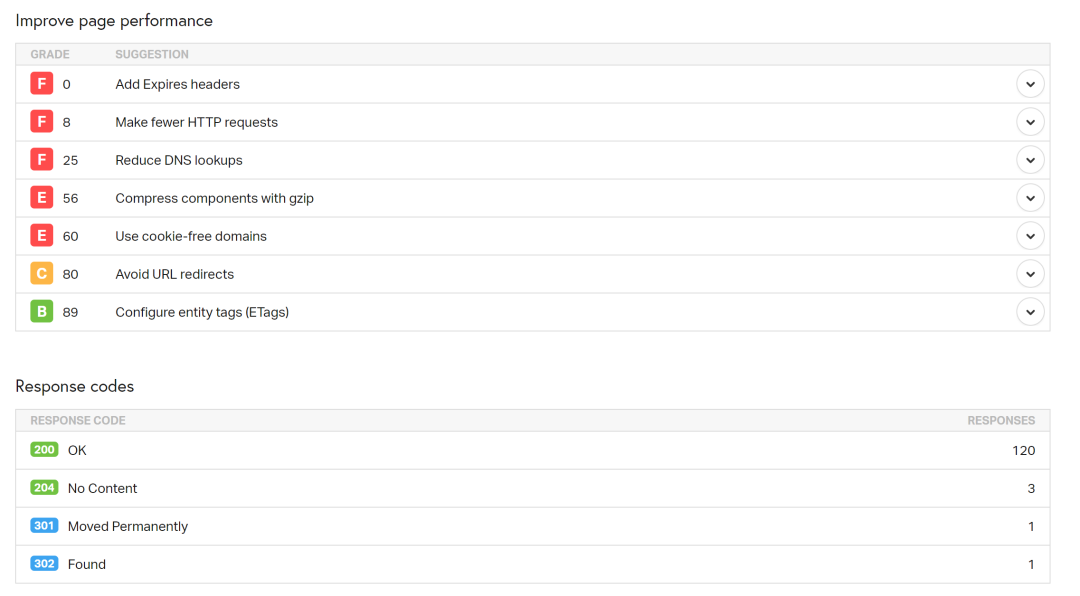
Pingdom Website Speed Test can comprehensively analyze the reasons that affect page loading speed, and analyze the size, detailed information of each element in the page, and the request time of each resource.
The site's slogan is very good: "The Internet is fragile, be the first to know that your site is in danger. "
Website address: https://tools.pingdom.com/
It is very simple to use, just enter the URL, select the test area, and click " START TEST ". The disadvantage is that it can only test pages that do not require login.
The test report looks like this:
3. PageSpeed Insights: Test page performance on mobile and desktop
PageSpeed Insights (PSI) is a website speed measurement tool developed by Google, which is mainly used to test the performance of pages on mobile devices and desktop devices, and to provide suggestions for improving pages.
Website address: https://pagespeed.web.dev/
The test report is as follows:
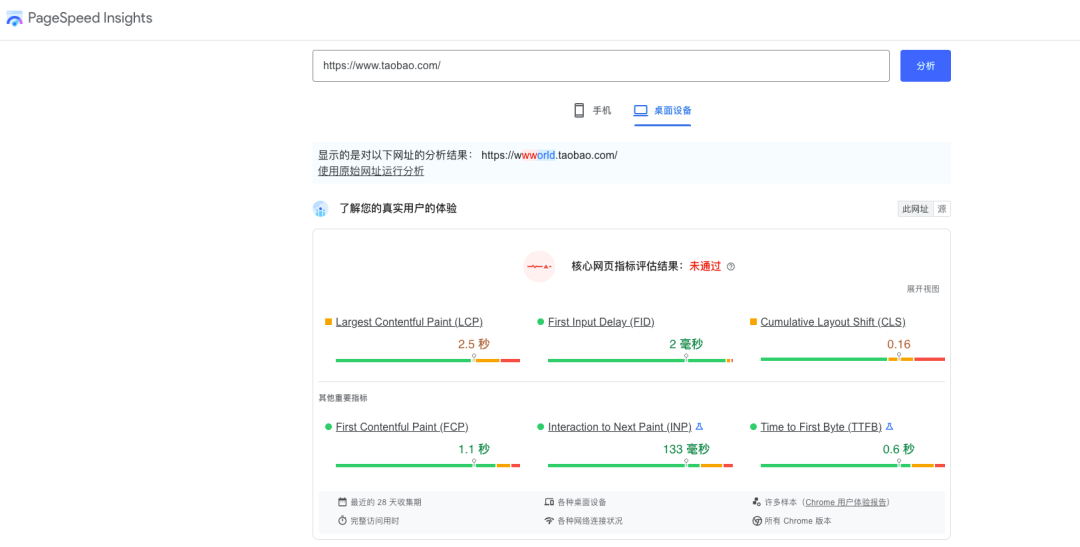
5. Chrome DevTools - Performance insights: Get actionable insights into website performance
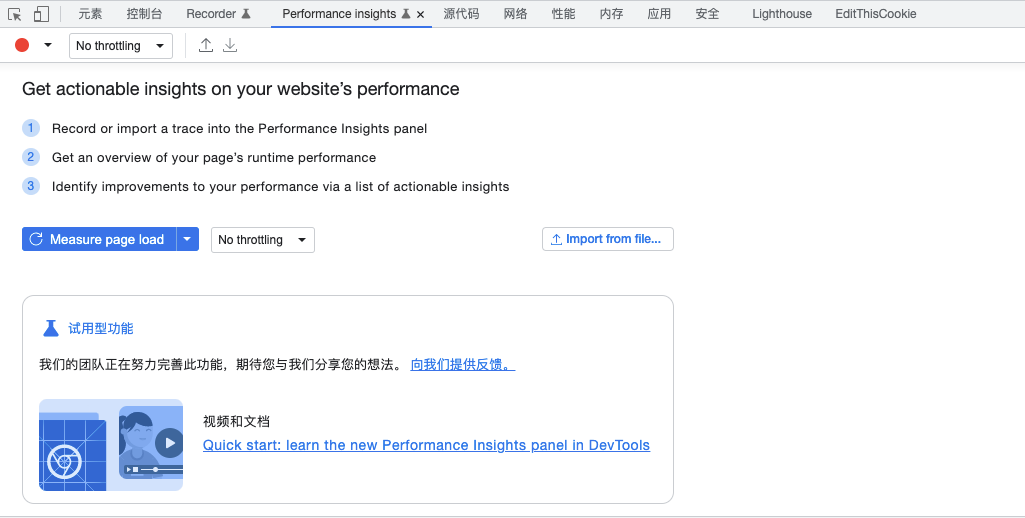
Usage reference: https://juejin.cn/post/7107537105664327716
6. Self-developed performance test platform
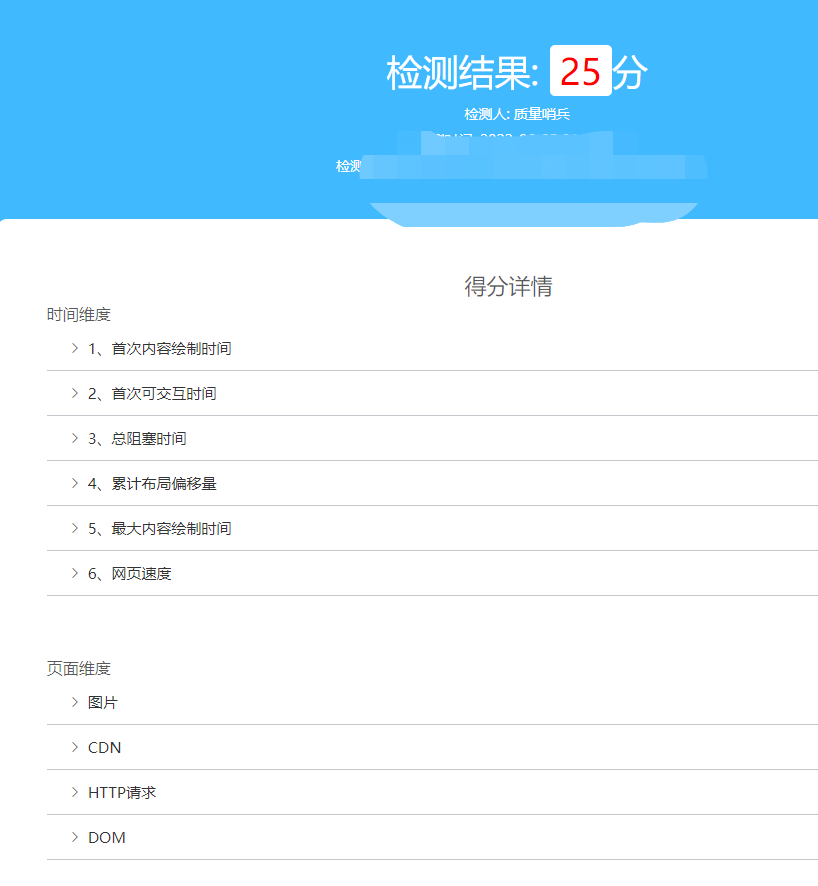
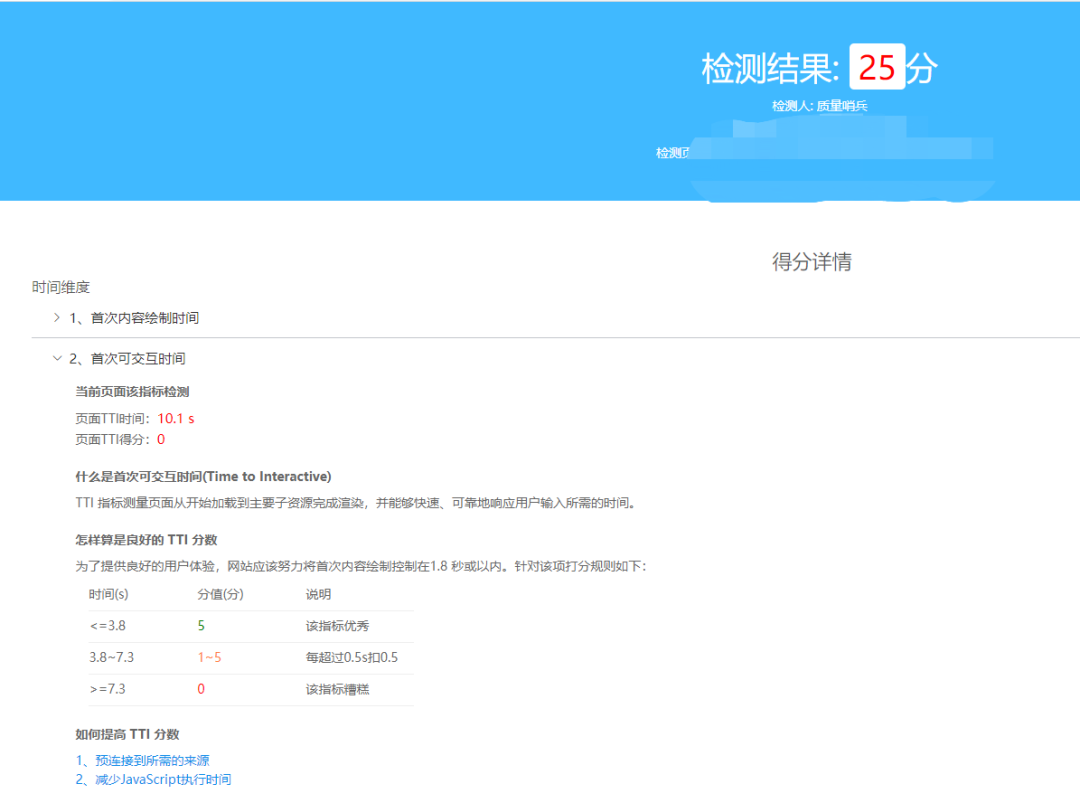
Different companies have different business characteristics, focus, performance requirements, etc., so custom development of front-end performance test platforms is also very common, generally based on Lighthouse development.
for example:
7. Performance testing of front-end components
The above is the performance test method of the page, but in fact, the page also contains a large number of components. For example: input box, scroll bar, calendar, etc. And components will also have performance problems. How to test the performance of components?
You can use Chrome DevTools .
testing method:
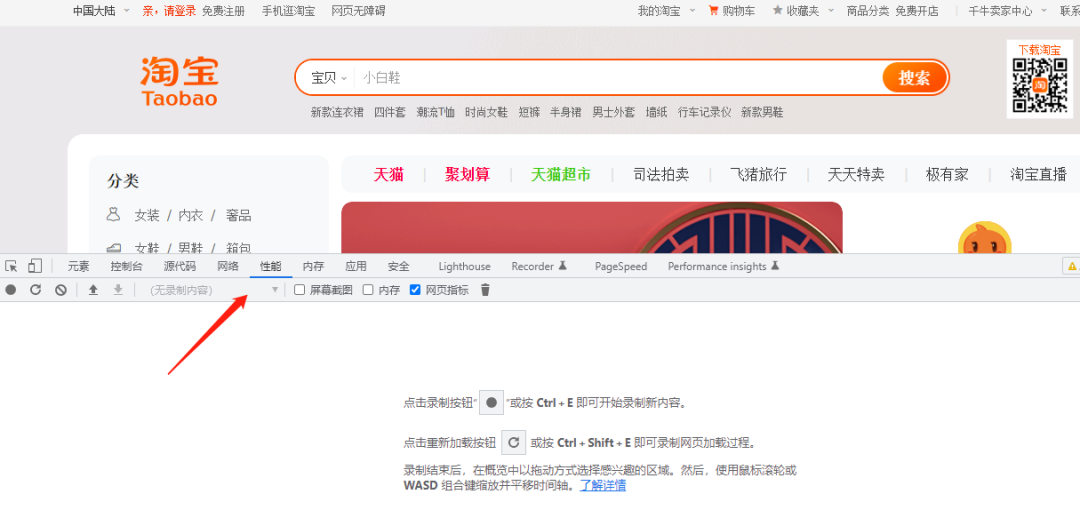
STEP 1. Enter the URL in Chrome, press F12, open Chrome DevTools, and click the "Performance" tab.
As follows:
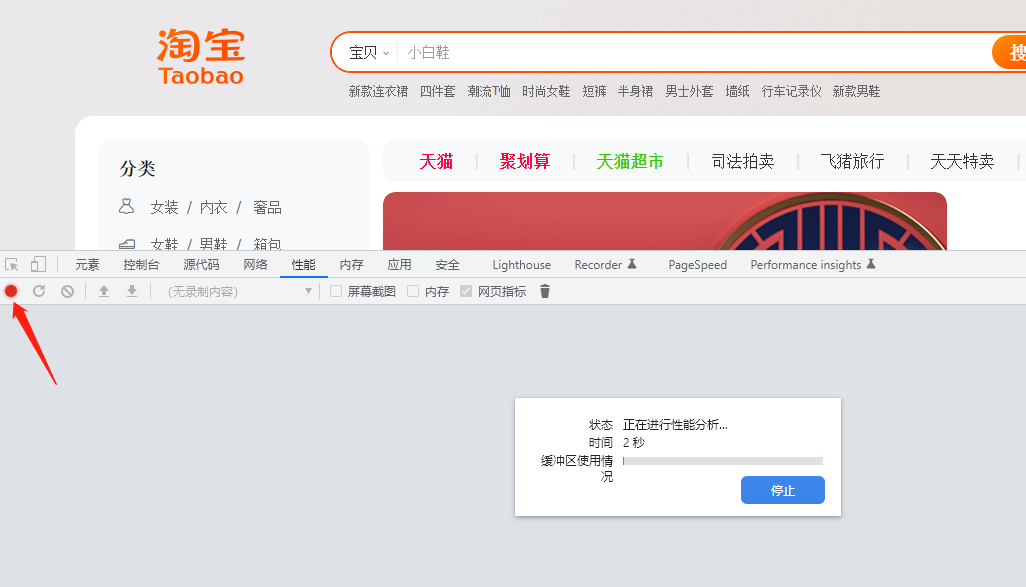
STEP 2. Click the record button in the upper left corner to start recording:
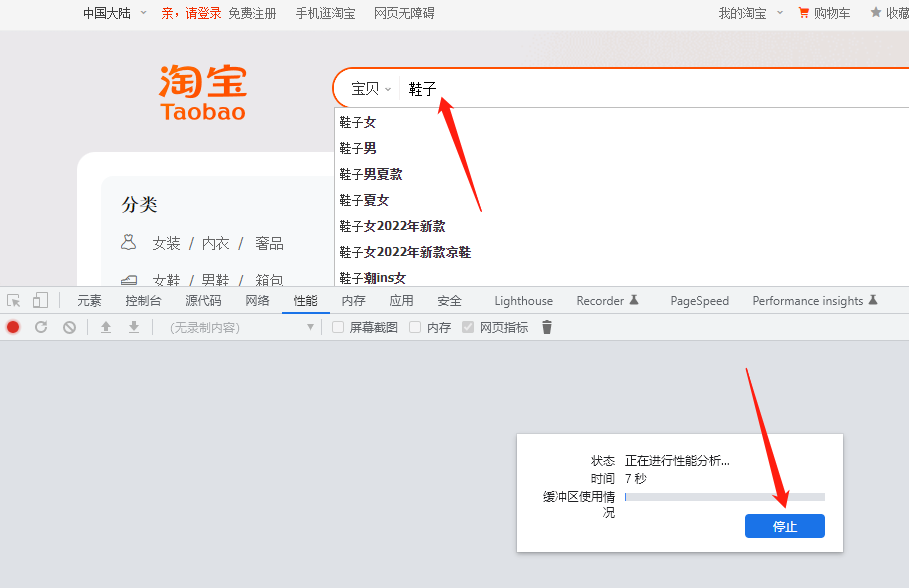
STEP 3. After operating on the component to be tested, stop recording.
STEP 4. A report will be automatically generated after recording is stopped, and the time-consuming summation of loading, script execution, rendering, and drawing can be done. This time reflects the performance of the component.
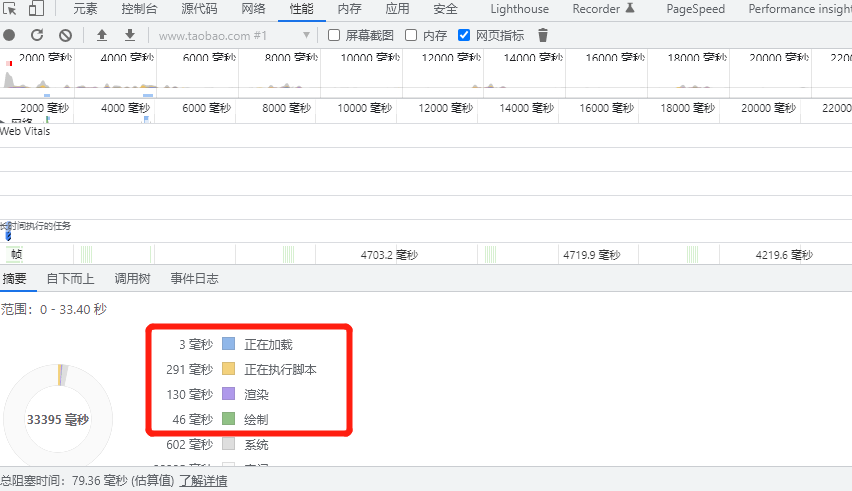
At present, there is no clear standard for the time-consuming of components, which is mainly based on smooth use and no stuttering. If there is performance optimization, this method can be used to provide performance optimization data.
4. Develop an appropriate testing strategy
Focus
Page performance to focus on:
-
Pages with high user traffic;
-
Features with high user clicks;
-
The primary/secondary important pages of the website;
-
Monitor and discover pages/functions that take a long time;
-
User feedback stuck pages/functions.
requires attention
-
Consistent configuration: select devices (operating system, system version, system settings, browser, browser version, etc.) that are consistent with or similar to the customer's configuration for testing;
-
Consistent data: use the same test data for each test;
-
Consistent operation: each operation scene should be consistent;
-
Consistent network: keep the network stable, and keep the same network (WIFI, 3G, 4G, 5G) and network speed for each test;
automatic testing
It is necessary to build a fixed front-end performance test environment, so as to ensure that the configuration, equipment, data, operation, and network are consistent, which facilitates the comparison of performance tests, and can be repeated by automated means.
for example:

Summarize
This article systematically introduces the idea of front-end performance testing from the process of web page loading, the indicators that are concerned in the process, the tools to obtain indicators, and the testing strategy, hoping to bring you some inspiration.
References:
-
https://serverless-action.com/fontend/fe-optimization
(Finish)
If the article is helpful to you, remember to leave a message, like, and follow !
Recommended reading:
-
Breaking news | The latest full stack test development skills practical guide in 2022 (issue 3)
-
Let's talk about career development: talk about three points!
END
Long press QR code/Wechat scan code to add author