This article mainly introduces how to use Prometheus to monitor mysql

1. Install and configure mariadb
1.1 Install mariadb
#Simple and direct yum install mariadb

yum -y install mariadb mariadb-server

systemctl start mariadb #Start    mariadb
 systemctl enable mariadb #Set   boot self-start

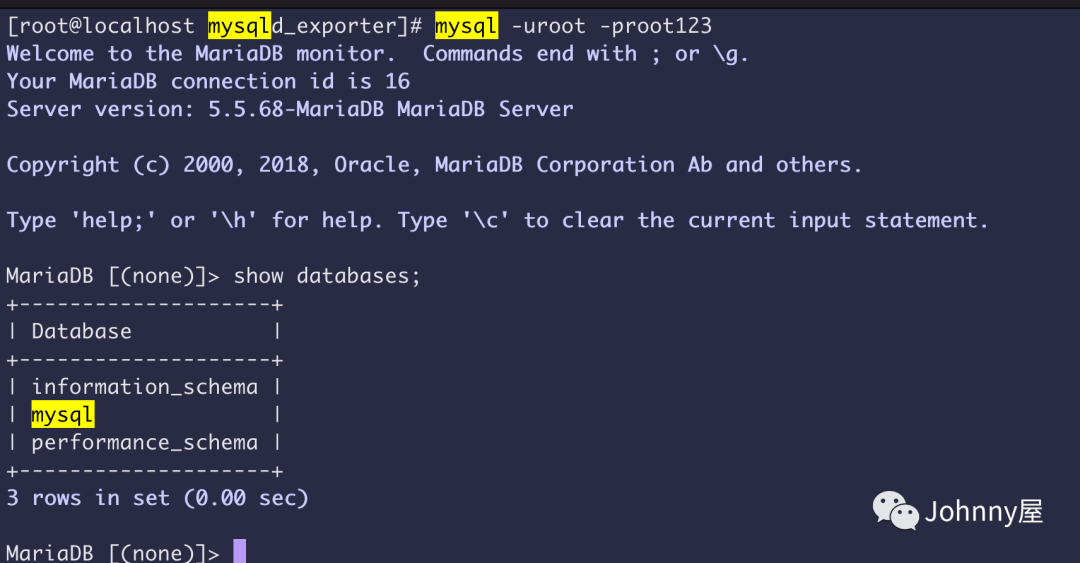
mysql_secure_installation #Set root password and other related
 mysql -uroot  -p root123 #Test            login

1.2 Configure mariadb to create users for exporter
# Create mysql_monitor user and grant permissions
 mysql> grant select, replication client, process ON *.* to 'mysql_monitor' @ 'localhost' identified by 'mysql123' ;

#Refresh configuration
 mysql> flush privileges;

mysql> quit

2.mysqld_exporter installation and configuration
2.1 Download mysqld_exporter
Address: https://prometheus.io/download/#mysqld_exporter

#Extract the tar file to /usr/local
 tar -zxvf mysqld_exporter -0.14.0.linux-arm64.tar.gz -C /usr/local

#Rename
mv mysqld_exporter-0.14.0.linux-arm64/ mysqld_exporter
2.2 Configure mysql account information
vi /usr/local/mysqld_exporter/.my.cnf

#Fill in the following content according to the specific situation is the mysql account created above
 [client]
user = mysql_monitor
password = mysql123
I put the .my.cnf configuration under mysqld_exporter

2.3 Start mysqld_exporter
You can see the help document through ./mysqld_exporter -h, and you can find the configuration method of the specified cnf file

# The location of the my-cnf file specified by --config.my-cnf is the one we created
 above./mysqld_exporter --config .my-cnf = /usr/local/mysqld_exporter/.my.cnf
Started successfully:

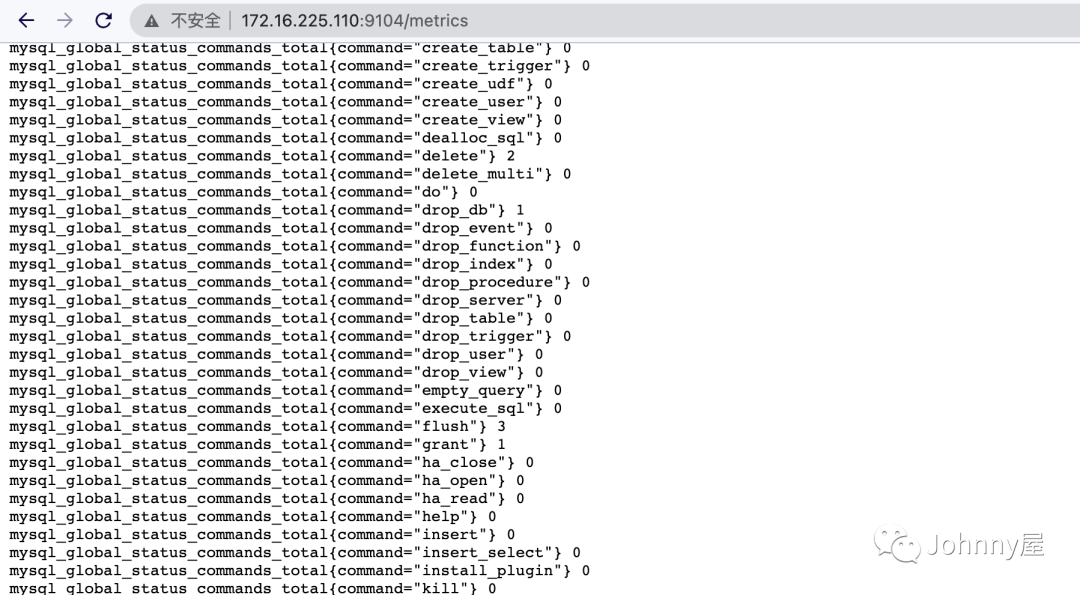
2.4 Access metrics default port 9104 of mysqld_exporter
I visit here: http://172.16.225.110:9104/metrics , you can see that the metrics have come out
3. Prometheus configure mysqld_exporter
When mysqld_exporter is configured and you can see the collected metrics, you can go to Prometheus to configure and pull it
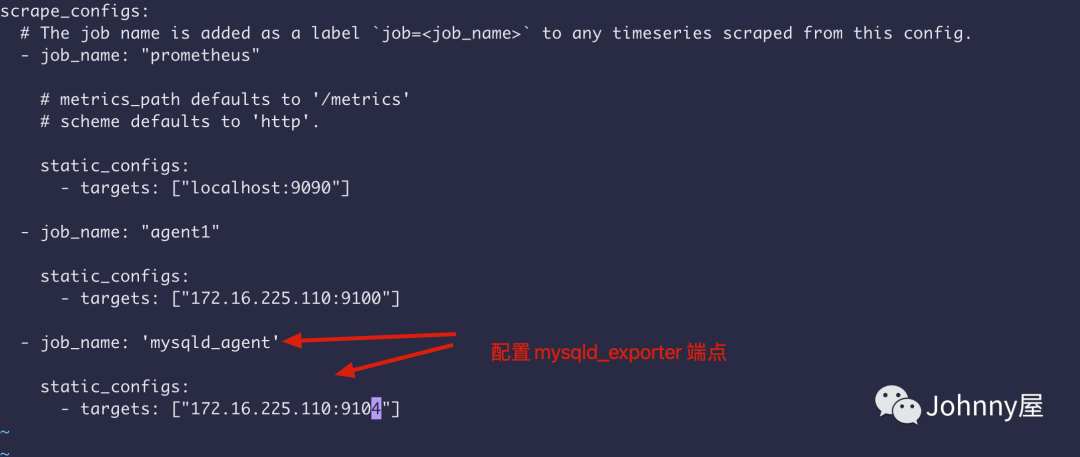
Modify the yml file of Prometheus to add the following job
  - job_name: 'mysqld_agent'

    static_configs: - targets: [ "172.16.225.110:9104" ]
# restart
 ./prometheus --config-file = prometheus.yml
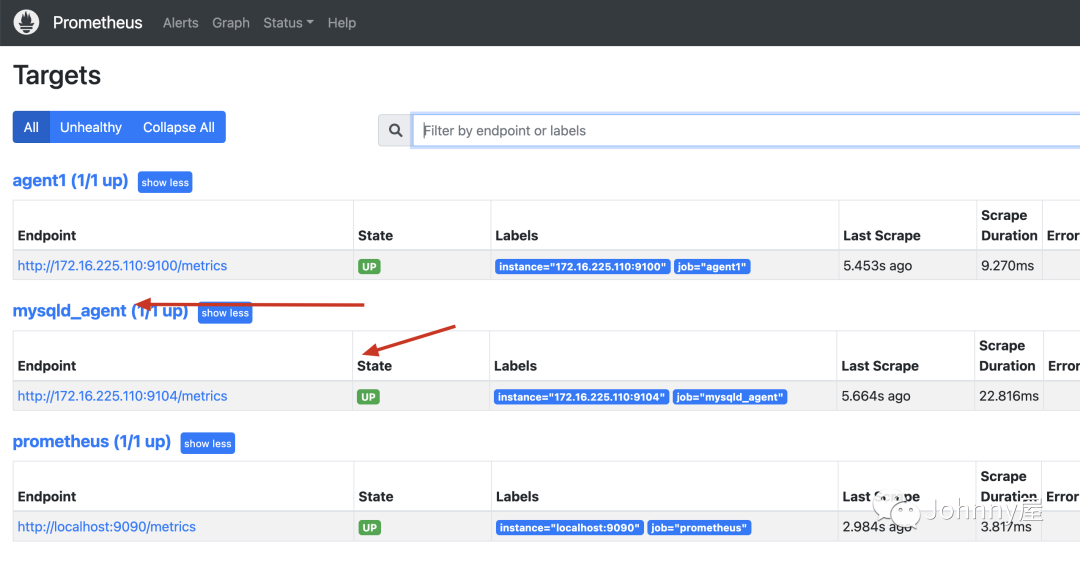
Log in to Prometheus to check Status/Targets and you can see that the mysqld_agent job is already up
4. Verify the query indicator mysql thread connection number
The first time to query the mysql_global_status_threads_connected indicator is that there is only one connection, and this connection is the connection of mysqld_exporter

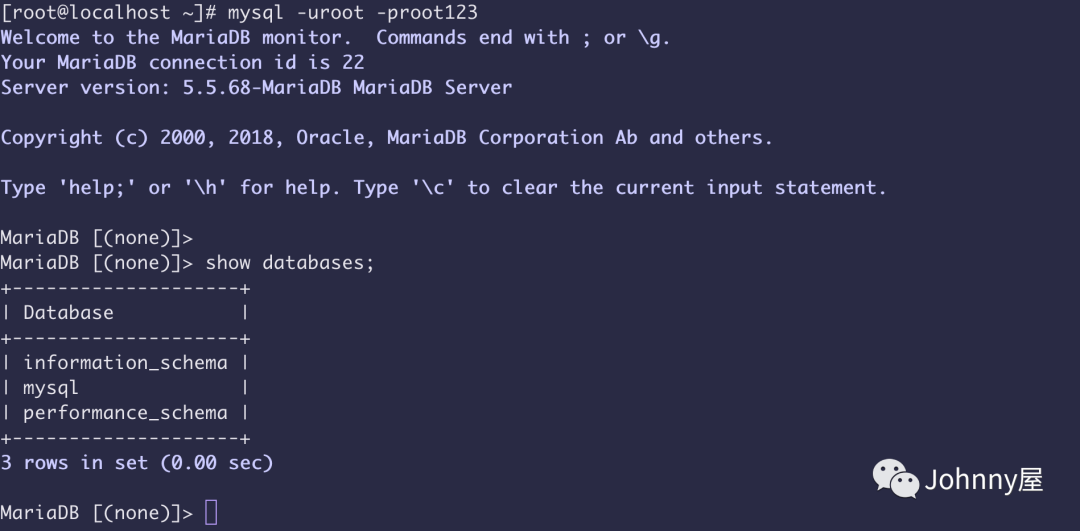
Open another terminal to connect to mysql
Waiting for a while to query again is 2 threads

Summarize
This article mainly introduces how Promethues monitors mysql, analyzes in detail how to use mysqld_exporter, and how to configure access in Prometheus. Recently, I need to supplement the relevant knowledge related to the monitoring of the operation and maintenance platform project.