10.4 Debug
In computer programs, debugging is the process of finding and reducing program errors. Obviously, this is a very practical job, and it cannot be completely mastered by reading a few pages of books. However, this does not mean that debugging skills cannot be learned. This section introduces several common methods based on experience for the reader's reference exercise - of course, take a Python program as an example, programs in other programming languages will be different.
1. Using the print() function
This is a very simple, intuitive method of debugging, and it is the most commonly used method in development practice. Use the print()function to output the necessary content in the code to the console, and judge the possible problems of the code by observing the output results. E.g:
#coding:utf-8
'''
filename: debugprint.py
'''
def mean(x, y):
    return x + y / 2

if __name__ == "__main__":
    a = input('input an integer:')
    b = input('input an other integer: ')
    aver = mean(a, b)
    print(f"{aver} is the average of {a} and {b}")
If the above program is run, an exception will be thrown.
% python debugprint.py
input an integer:2
input an other integer: 4
Traceback (most recent call last):
  File "/Users/qiwsir/Documents/my_books/codes/debugprint.py", line 11, in <module>
    aver = mean(a, b)
  File "/Users/qiwsir/Documents/my_books/codes/debugprint.py", line 6, in mean
    return x + y / 2
TypeError: unsupported operand type(s) for /: 'str' and 'int'
According to the knowledge that has been learned, the cause of the abnormality can be known "at a glance". For the time being, please pretend you don't know so that you can "play on".
From the traceback (Traceback), we can see that the final problem is line 6 in return x + y / 2. Since the two parameters of the function are used here, you should first see what the values of mean()the are. So it can be added in the function print()(note that only the printout is added, no other changes to the program are made).
#coding:utf-8
'''
filename: debugprint.py
'''
def mean(x, y):
    print(f"{x}==>{type(x)}")
    print(f"{y}==>{type(y)}")
    return x + y / 2

if __name__ == "__main__":
    a = input('input an integer:')
    b = input('input an other integer: ')
    aver = mean(a, b)
    print(f"{aver} is the average of {a} and {b}")
The result after execution is:
% python debugprint.py
input an integer:2
input an other integer: 4
2==><class 'str'>
4==><class 'str'>
Traceback (most recent call last):
  File "/Users/qiwsir/Documents/my_books/self-learning-python-codes/codes/debugprint.py", line 13, in <module>
    aver = mean(a, b)
  File "/Users/qiwsir/Documents/my_books/self-learning-python-codes/codes/debugprint.py", line 8, in mean
    return x + y / 2
TypeError: unsupported operand type(s) for /: 'str' and 'int'
It can be seen from the above output that mean()the are of the same type as the input ones, and their types are strings. This finds the cause of the TypeError: unsupported operand type(s) for /: 'str' and 'int'exception , and can formulate a modification plan.
When the input variables aand bare converted into integers or floating-point numbers, although there is no above exception information, the program still has "logical errors" - please debug and modify it by yourself.
2. Using the pdb module
The pdb module in the Python standard library is an interactive code debugger, which can be used to set breakpoints, single-step execution, etc. (official documentation: https://docs.python.org/zh-cn/3/library /pdb.html).
In Python interactive mode, do the following.
>>> import pdb
>>> def fun(x, y):
...     z = x + y
...     k = x * y
...     r = z / k
...     return r
...
>>> pdb.run("fun(1, 0)")      # (1)
> <string>(1)<module>()->None
(Pdb)
Note (1) Use the pdb.run()function to execute the function defined earlier fun()- the function must be provided with an argument. After writing the code shown in comment (1), press Enter, the following information will appear, the cursor will stay behind , waiting for (Pdb)the input command. Enter n(next), which means to continue running, and the following results appear:
>>> pdb.run("fun(1, 0)")       # (1)
> <string>(1)<module>()->None
(Pdb) n
ZeroDivisionError: division by zero
> <string>(1)<module>()->None
(Pdb)
Indicates that an ZeroDivisionErrorexception . Continue typing nuntil debugging ends, returning to >>>state.
> <string>(1)<module>()->None
(Pdb) n
--Return--
> <string>(1)<module>()->None
(Pdb) n
Traceback (most recent call last):
  File "<stdin>", line 1, in <module>
  File "/Library/Frameworks/Python.framework/Versions/3.9/lib/python3.9/pdb.py", line 1597, in run
    Pdb().run(statement, globals, locals)
  File "/Library/Frameworks/Python.framework/Versions/3.9/lib/python3.9/bdb.py", line 580, in run
    exec(cmd, globals, locals)
  File "<string>", line 1, in <module>
  File "<stdin>", line 4, in fun
ZeroDivisionError: division by zero
>>>
If you use the pdbmodule to debug the program, take the previously written debugprint.pyfile as an example, at the location of the file, execute the following instructions and enter the (Pdb)state .
% python3 -m pdb debugprint.py
> /Users/qiwsir/Documents/my_books/codes/debugprint.py(2)<module>()
-> '''
(Pdb)
Displays the program documentation that has been executed up debugprint.pyto the second line of the file. Then wait for the input of subsequent debugging instructions.
Enter lto display all the codes of the currently debugged program (the display is omitted here).
Enter nto step through.
(Pdb) n
> /Users/qiwsir/Documents/my_books/codes/debugprint.py(5)<module>()
-> def mean(x, y):
(Pdb)
This brings you to the functions mean()section . So, debug step by step.
> /Users/qiwsir/Documents/my_books/codes/debugprint.py(10)<module>()
-> if __name__ == "__main__":
(Pdb) n
> /Users/qiwsir/Documents/my_books/codes/debugprint.py(11)<module>()
-> a = input('input an integer:')
(Pdb) n
input an integer:2
> /Users/qiwsir/Documents/my_books/codes/debugprint.py(12)<module>()
-> b = input('input an other integer: ')
(Pdb) n
input an other integer: 4
> /Users/qiwsir/Documents/my_books/codes/debugprint.py(13)<module>()
-> aver = mean(a, b)
(Pdb) n
2==><class 'str'>
4==><class 'str'>
TypeError: unsupported operand type(s) for /: 'str' and 'int'
> /Users/qiwsir/Documents/my_books/codes/debugprint.py(13)<module>()
-> aver = mean(a, b)
(Pdb) n
--Return--
> <string>(1)<module>()->None
(Pdb)
until an exception is found.
Enter in (Pdb)state to qreturn to >>>Python interactive mode.
In addition to step-by-step debugging, you can also use pdbmodules , such as the following modifications:
#coding:utf-8
'''
filename: debugprint.py
'''
import pdb
def mean(x, y):
    print(f"{x}==>{type(x)}")
    print(f"{y}==>{type(y)}")
    pdb.set_trace()            # (2) 到此则自动暂停
    return x + y / 2

if __name__ == "__main__":
    a = input('input an integer:')
    b = input('input an other integer: ')
    aver = mean(a, b)
    print(f"{aver} is the average of {a} and {b}")
Execute this program, and the program will automatically pause at the comment (2).
% python debugprint.py
input an integer:2
input an other integer: 4
2==><class 'str'>
4==><class 'str'>
> /Users/qiwsir/Documents/my_books/self-learning-python-codes/codes/debugprint.py(10)mean()
-> return x + y / 2
(Pdb)
p aEntering displays athe value of the variable, and typing p bdisplays bthe value of the variable.
(Pdb) p a
'2'
(Pdb) p b
'4'
(Pdb) n
TypeError: unsupported operand type(s) for /: 'str' and 'int'
> /Users/qiwsir/Documents/my_books/self-learning-python-codes/codes/debugprint.py(10)mean()
-> return x + y / 2
This also locates the problem.
Here only a brief example is used to illustrate the application of pdbmodules in debugging. For more complex debugging commands, please refer to the official documentation.
3. Use the IDE's debugging function
At present, the commonly used IDEs all provide very friendly debugging functions. I am afraid that this is the more commonly used by developers print()except for . Let's take Visual Studio Code (VS Code for short) as an example to illustrate the debugging method (other IDEs also have debugging functions, you can refer to the relevant special materials).
Debugging is included if you have installed the Python extension on Visual Studio Code as described in Chapter 1, Section 1.8.3.
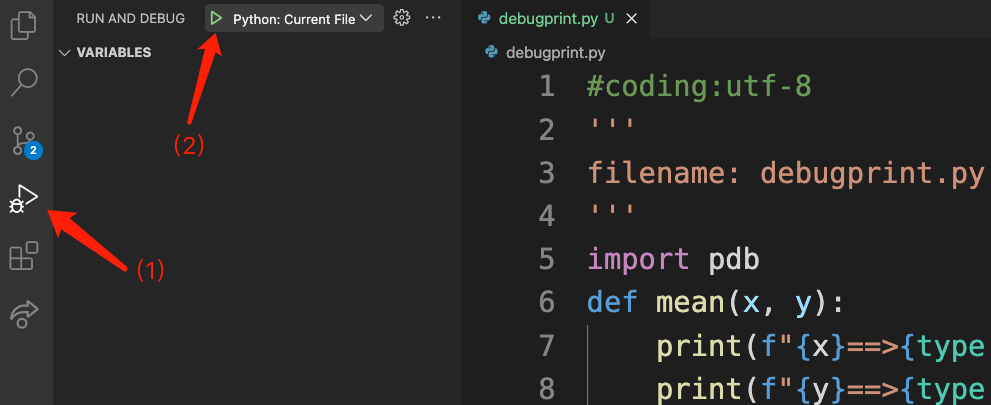
As shown in Figure 10-4-1, click the Run and Debug (Run and Debug, as shown by arrow (1)) button in the left activity bar to enter the debugging interface, click the button shown by arrow (2) or Press the shortcut key F5to run the current Python program (still using debugprint.pyas an example ).
Pay attention to observing the terminal, you will be prompted to input two integers, and after inputting them in sequence, the state shown in Figure 10-4-2 will appear.
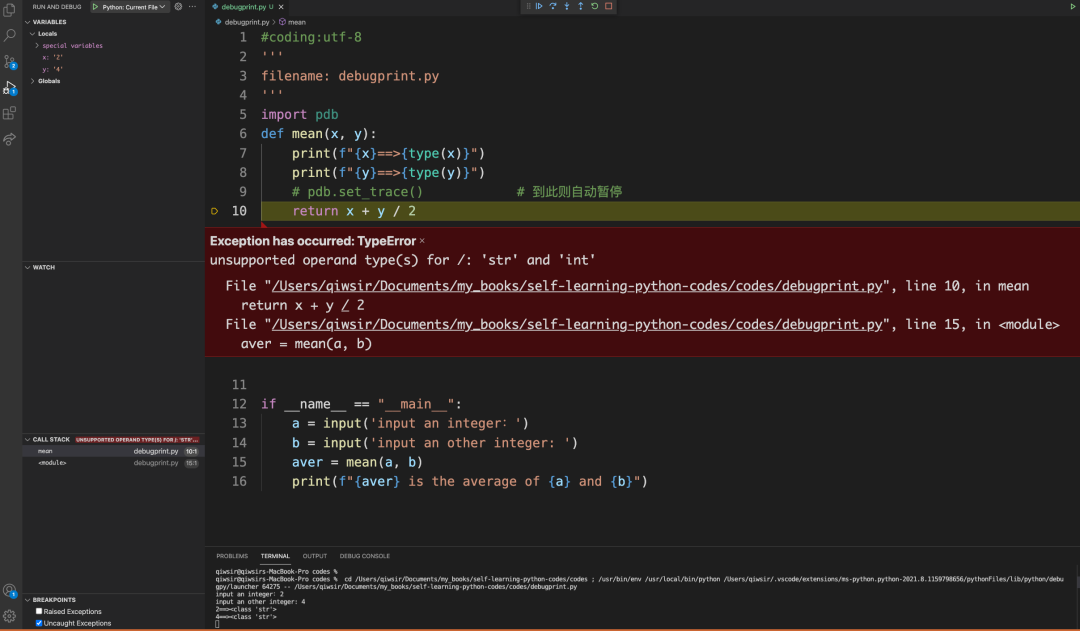
The most prominent place in the middle shows the line that currently throws the exception and relevant exception information; the left side shows relevant debugging information; there are several buttons at the top, which can realize single-step execution.
"Breakpoint" is an important skill for debugging programs. In VS Code, you can click the mouse on the left side of any logic line (as shown in Figure 10-4-3), then set it to a breakpoint, and the program The operation stops here.
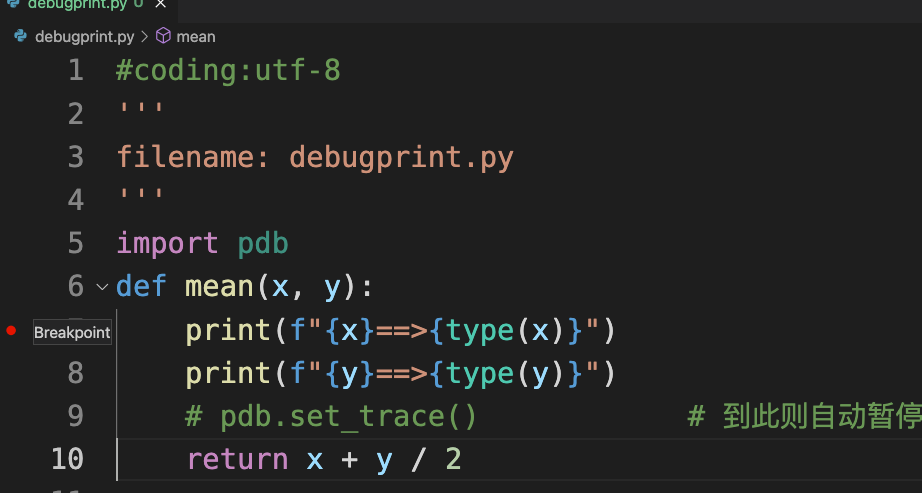
Execute the program, when it runs to the breakpoint position shown in Figure 10-4-3, the effect shown in Figure 10-4-4 will be displayed.
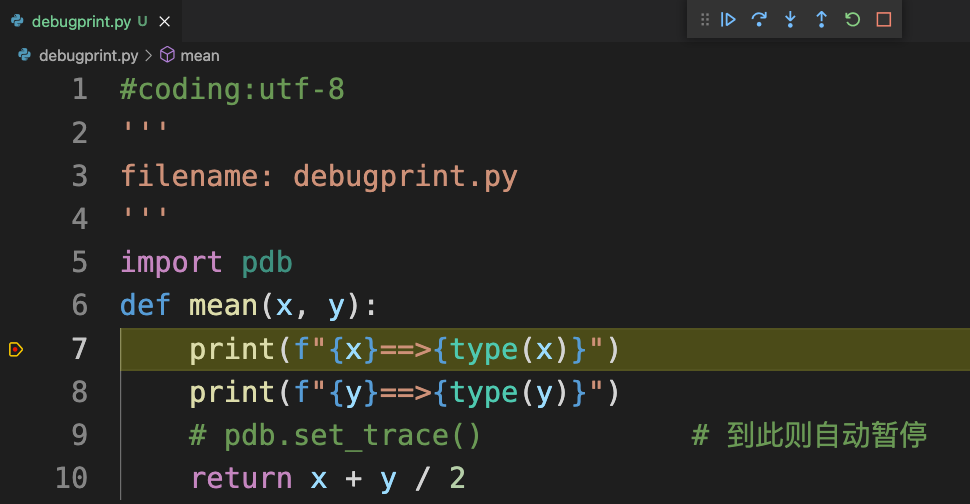
After this you can continue down by clicking the button at the top.
In VS Code, you can specify more complex debugging functions by configuring the launch.json file. The introduction to the application of VS Code has gone beyond the scope of this book, and readers can refer to relevant special materials. In short, various IDEs provide simple and intuitive debugging functions and are good tools for debugging programs.
★
Self-study advice
In Chapter 1, Section 1.8.3, [Self-study Suggestions], it is not recommended that readers spend too much energy on the selection and configuration of IDE, because they are just starting to program, and their attention should not be too distracting. Times have changed, and now that I have typed a lot of code, I have enough programming experience, and I am familiar with my computer. It is very necessary to make the tools for producing code more advanced. Therefore, it is particularly recommended that readers should spend some time in-depth research on their chosen IDE, configure various functions to improve efficiency, and apply them to the practice of writing code and debugging programs.
"
Click [read the original text] to view more content of the open source book "Python Complete Self-study Course"