The 8th "Force Unleashing Cloud Native Observability Sharing Session" Spruce Network R&D VP Xiang Yang shared "DeepFlow - Opening a New Era of Highly Automated Observability" , the first open source version of DeepFlow was officially released , it is a highly The automated observability platform can significantly reduce the burden of burying, coding, and maintenance for developers.
Click the card below to watch the video playback.
 Bilibili , Transaction Guarantee , Buy with Confidence , DeepFlow
  - Mini Programs thatOpen a New Era of Highly Automated Observability
Hello friends in the live broadcast room, I am very happy to share with you the official release of the first open source version of DeepFlow. I believe that through my introduction today , everyone can feel a new era of highly automated observability, let us witness and open it together.
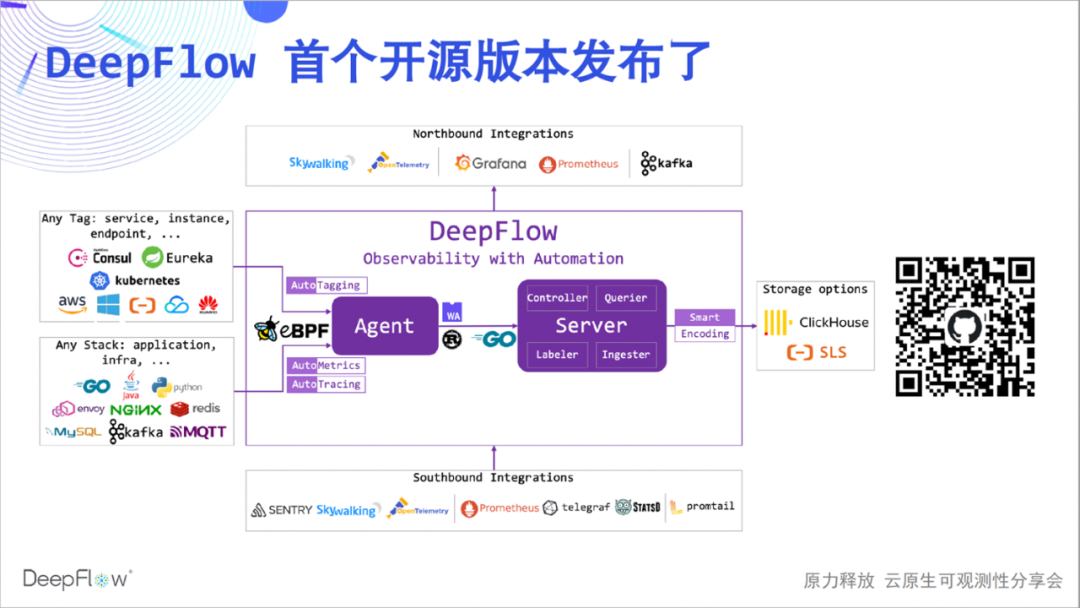
The following is the architecture diagram of the DeepFlow community version. Some friends don't know much about DeepFlow, so I will briefly introduce it. DeepFlow is a self-developed observability platform of Yunshan Network. Based on a series of innovations in eBPF and other technologies, it is highly automated, which significantly reduces the workload for developers to build observability.
We can see that it can automatically synchronize resources, services, K8s custom Label and inject it into observation data as a label (AutoTagging), it can automatically collect application performance metrics and tracking data without coding (AutoMetrics, AutoTagging), it The innovative SmartEncoding mechanism reduces tag storage resource consumption by a factor of 10. In addition, it has good integration capabilities, can integrate a wide range of data sources, and provides a good northbound interface based on SQL. The core of DeepFlow is open source based on Apache 2.0 License, welcome to give us 🌟 Star ( scan the QR code below )!
When we're talking about high levels of automation, what message are we trying to convey? Today's sharing will start from four aspects:
-
First, it introduces AutoMetrics, the automatic indicator data collection capability of DeepFlow, which automatically displays the relationship between full-stack performance indicators and panoramic services;
-
Next is the automated Prometheus and Telegraf integration capabilities, which gather the most complete indicator data and solve the problem of data silos and high cardinality;
-
After that, I will take you to experience AutoTracing, DeepFlow's innovative automated distributed tracing capability based on eBPF. I believe this is definitely a world-class innovation;
-
Finally, the automated OpenTelemetry and SkyWalking integration capabilities demonstrate amazing distributed tracking capabilities without blind spots and solve the pain of incomplete tracking.
A high degree of automation can allow developers to spend more time on business development, and teams can work together to solve problems more smoothly.
So let's take a look at today's first bullet, AutoMetrics.
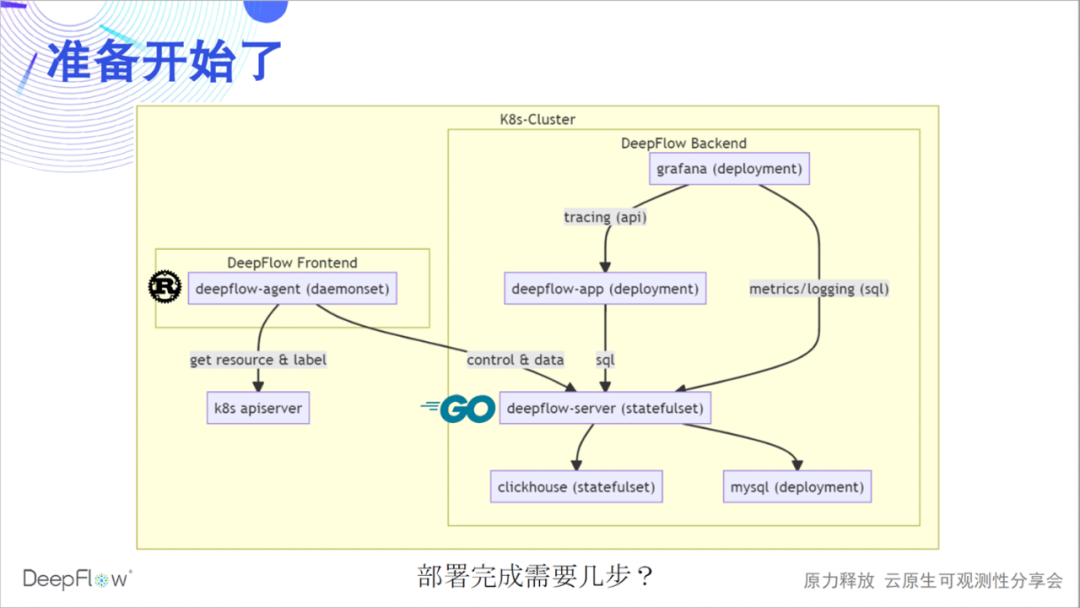
Let's warm up and deploy a complete set of DeepFlow. The following figure shows the software architecture of DeepFlow more clearly: the deepflow-agent implemented by Rust collects data as the frontend, and synchronizes resources and Label information with the K8s apiserver; the deepflow-server implemented by Golang is responsible for management control, load sharing, and storage query as the backend. . We use MySQL to store metadata, ClickHouse to store observations and support extension replacement, and Grafana to display observations.
At present, we also have a deepflow-app process implemented in Python to provide distributed tracing API, which will be rewritten in Golang and gradually merged into deepflow-server. deepflow-server provides SQL API upwards, based on which we developed Grafana's DeepFlow DataSource and Panels such as topology and distributed tracing. deepflow-agent can run in the host or K8s environment, but deepflow-server must run in K8s. Let's guess how many steps it takes to deploy DeepFlow in a K8s cluster?
Yes, it only takes one step, copy and paste these few helm names to complete the deployment. If you have a computer by your side, you can refer to the deployment documentation to deploy now, and look forward to providing feedback on the deployment experience in the live broadcast room or in our WeChat group.
helm repo add deepflow https:helm repo update deepflowhelm install deepflow -n deepflow deepflow/deepflow --create-namespace
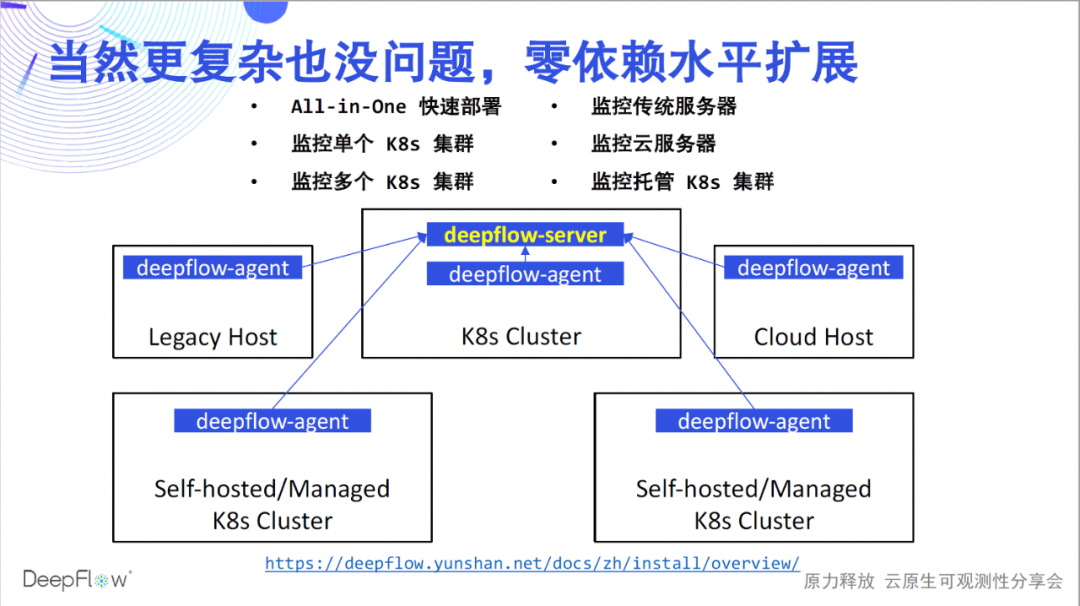
The deployment just now only solves the monitoring problem of a K8s cluster, and the capabilities of DeepFlow are of course not limited to this. Referring to the deployment documentation , DeepFlow can be smoothly deployed in various scenarios. We support fast All-in-One single-node experience; support monitoring multiple K8s clusters and automatically inject K8s resources and custom Label labels for all data; support monitoring traditional servers and cloud servers and automatically inject cloud resource labels for all data; Finally, we also support monitoring managed K8s clusters and automatically inject K8s and cloud resource tags. In all these scenarios, DeepFlow can scale horizontally without relying on any external components. Now that the deployment is complete, let's start our highly automated observability journey.
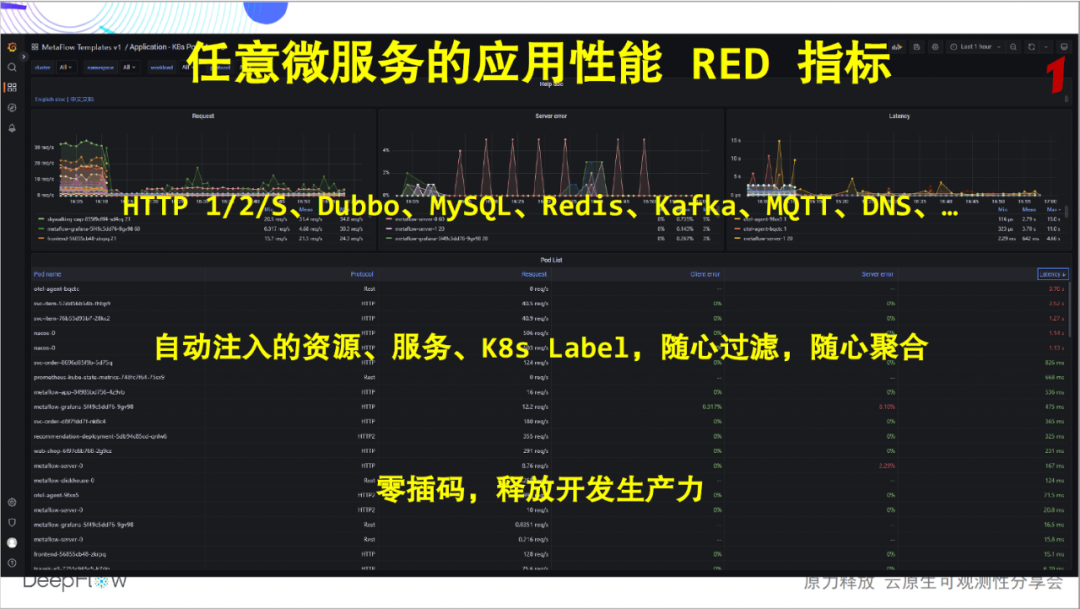
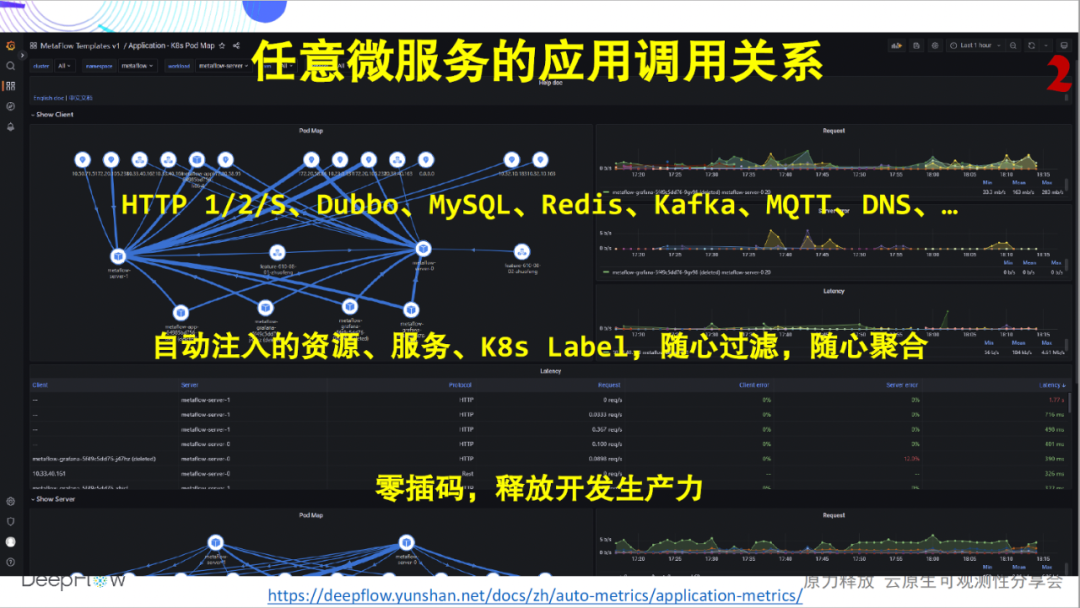
 The golden indicators we most often talk about are generally the Request, Error, and Delay of the service. The following figure shows the application performance RED indicators of any microservice that can be displayed after DeepFlow is deployed, no matter what language it is implemented in. We currently support the collection of metrics data for HTTP 1/2/S, Dubbo, MySQL, Redis, Kafka, MQTT, and DNS applications, and the support list is still growing. We will automatically inject dozens or even hundreds of dimension label fields for all indicator data, including resources, services, and K8s custom Labels, which allows users to aggregate and drill down flexibly. But here we want to emphasize the ability of automation. The development team of these indicators will no longer have to worry about plugging in code, and the operation and maintenance team will no longer have to worry about always pushing the development to plug in code. The automation of DeepFlow makes each team more productive and teamwork more harmonious.
 Looking at another picture, in addition to a single service, DeepFlow can also present the application call relationship between any microservices. Again, completely zero-interpolation. Through the document , you can log in to our online Demo environment for real-life experience.
Is that all there is to it? Much more than that! In a cloud-native environment, the complexity of the network increases significantly, becoming a black box for troubleshooting, and locating problems is usually guesswork. DeepFlow has full-stack monitoring capabilities of application performance, and can automatically collect hundreds of indicators such as throughput, connection establishment exception, connection establishment delay, transmission delay, zero window, retransmission, concurrency, etc. of any microservice . Inject dozens or even hundreds of resources, services, and K8s custom Label labels.
Similarly, DeepFlow can also present the network call relationship between any microservices. Still completely zero-interpolation.
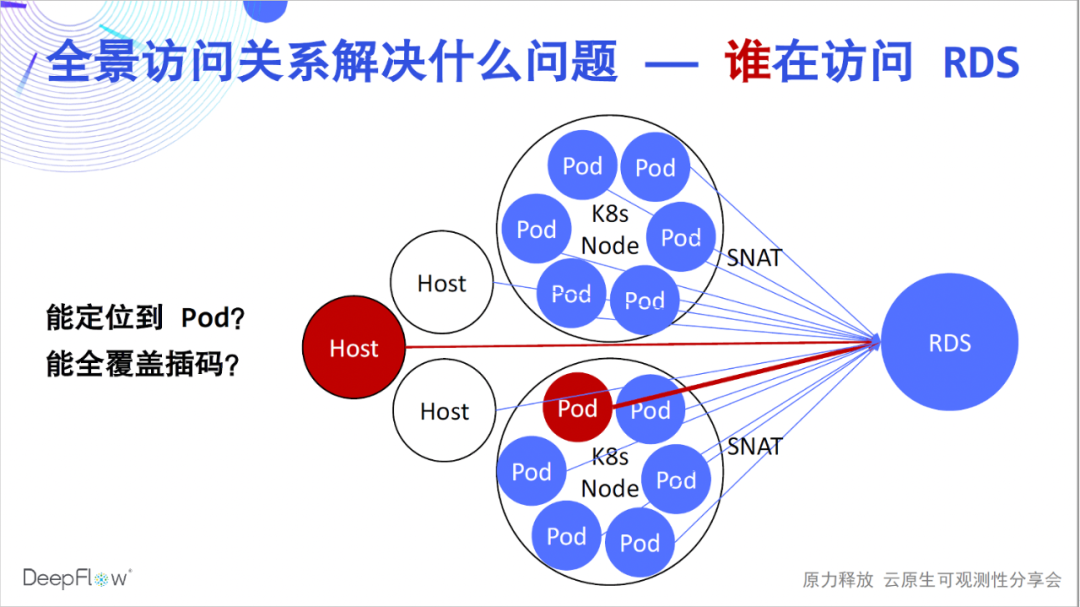
Well, I believe that everyone has begun to feel the breath of high automation more truly. But what problems do they solve? Relying on the automatic panoramic access relationship, DeepFlow Enterprise Edition customers can quickly solve a large number of fault location problems, such as RDS operation and maintenance used to locate which client caused the largest access load. Due to the existence of SNAT in the K8s environment, there is no way to know which Pods are accessing. In the traditional method, we can only insert codes on the client side, but it is difficult to achieve comprehensive coverage. Solving such problems with DeepFlow is a snap, simply search the RDS to get performance metrics for all clients accessing it.
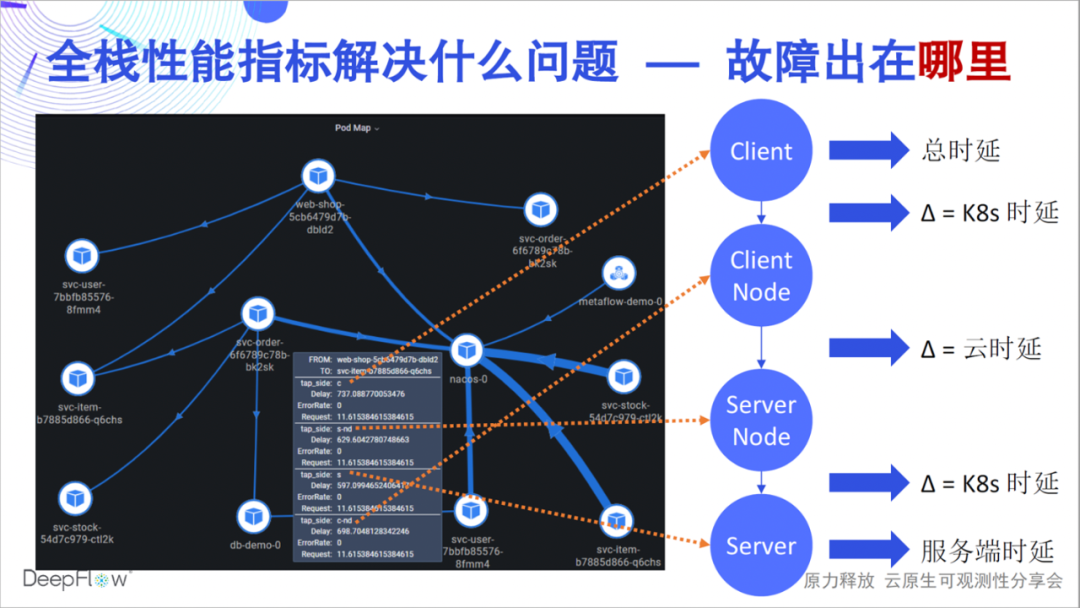
 So what problems can full-stack performance metrics solve? A fault may be that the latency of an API is too high, but which link is the cause of the latency, which team should be responsible for, and how fast can your team solve such a problem? The full-stack capability of DeepFlow can quickly answer the performance status of an access relationship in each key node. For example, as shown in this figure, we can accurately distinguish whether the bottleneck is in the server Pod, service K8s network, cloud network, and client K8s The network, or the client itself. DeepFlow makes troubleshooting in a distributed environment as easy as a single machine, while still being fully automated.
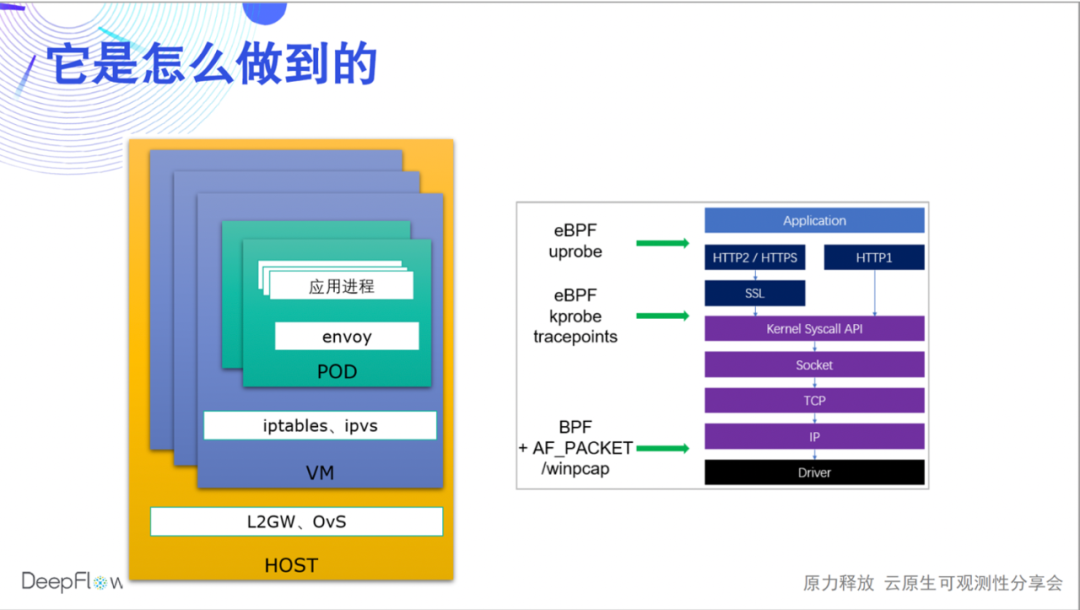
 How does DeepFlow do it? Today we can only touch the water, and there will be more live broadcasts and articles to share the underlying mechanism. We use eBPF and BPF to collect the performance data of each request (Flow in the name of DeepFlow) during application, system calls, and network transmission, and automatically associate them. In this way, on the one hand, we can cover all communication endpoints (microservices), and on the other hand, we can also associate the performance data of each hop to quickly locate the problem in the application process, Sidecar, Pod virtual network card, and Node network card. , DeepFlow Enterprise Edition can continue to locate host network cards, NFV gateway network cards, physical network element ports, etc.
 There is still a lot of work to continue iterating on. We know that the header fields of HTTP2/gRPC are compressed. Currently, we support protocol header parsing based on static compression tables. In the future, we will use eBPF uprobe to obtain dynamic compression tables for complete header parsing. For HTTPS, we currently support eBPF uprobe's ability to collect Golang applications, and will gradually support C/C++/Java/Python and other languages in the future. At the same time, we also understand that there will be a large number of private application protocols in the actual business environment, and we hope to provide developers with flexible programmability through WebAssembly technology.
But these indicators alone are not perfect, and observability requires as much data as possible. Next, we introduce DeepFlow's automated indicator data integration capabilities.
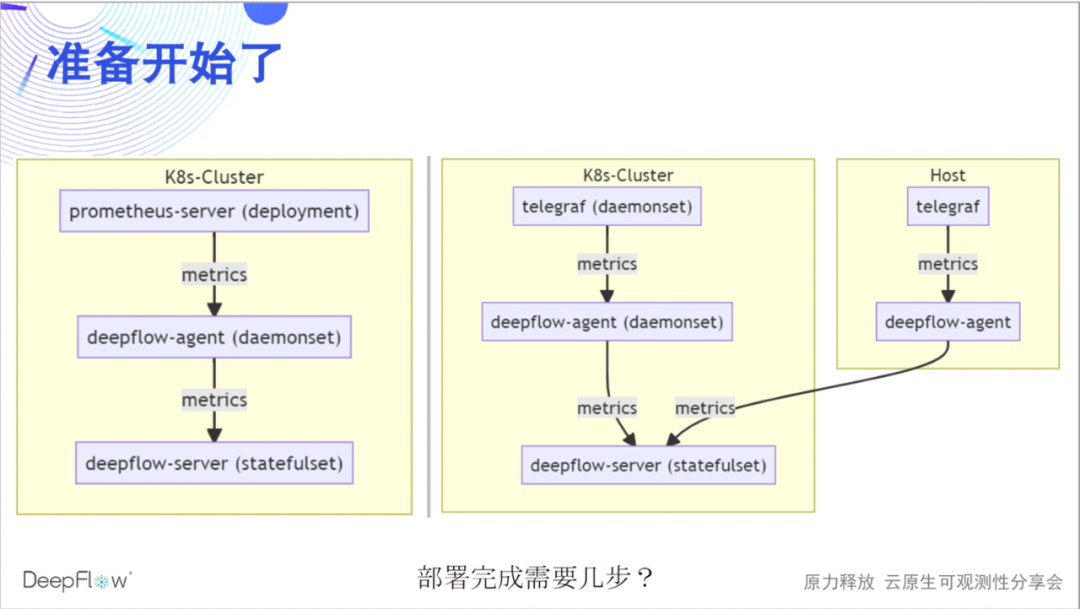
The following figure shows the integration method of DeepFlow, Prometheus and Telegraf. We integrate data through deepflow-agent, as a remote-storage endpoint of prometheus-server, or as an output endpoint of telegraf. The whole process is relatively simple. Do you think it takes a few steps to complete such a deployment?
It only takes two steps to modify a configuration on the prometheus/telegraf and deepflow-agent sides respectively. The configuration on this side of DeepFlow is actually just a switch. We do not turn it on by default. We expect that deepflow-agent will not listen to any ports by default, and will have zero intrusion on the running environment.
# prometheus-server config remote_write: - url: http: # telegraf config [[outputs.http]] url = "http://${DEEPFLOW_AGENT_SVC}/api/v1/telegraf" data_format = "influx" # deepflow config vtap_group_id: <your-agent-group-id> external_agent_http_proxy_enabled: 1
Such a simple configuration can also be tried in various complex scenarios, covering multiple K8s clusters and cloud servers, and can be scaled horizontally without the assistance of any external components.
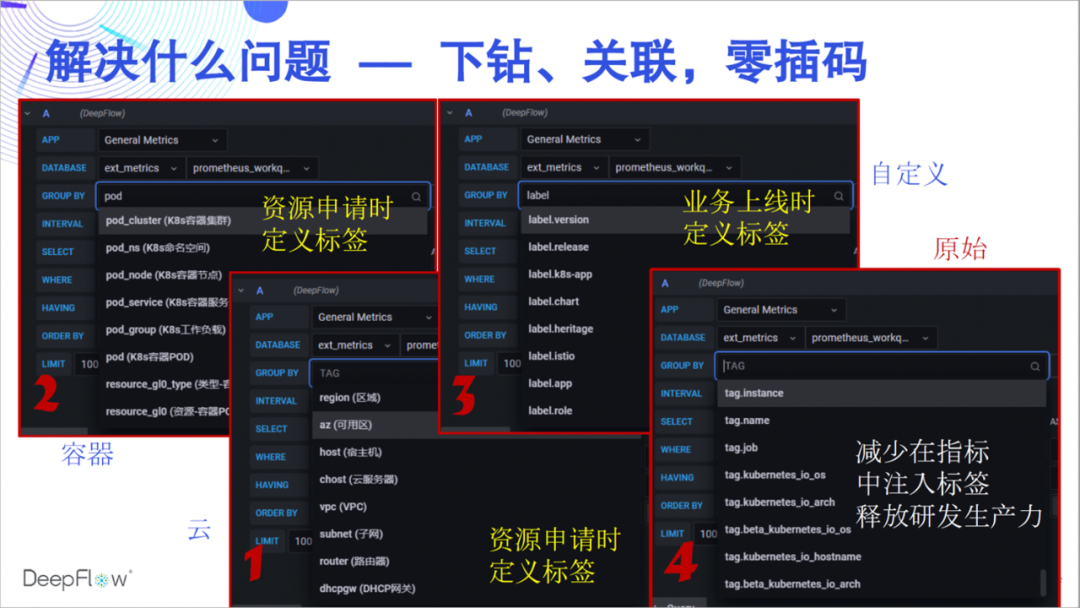
Why collect data into DeepFlow? Let's first feel the powerful AutoTagging capabilities. We automatically inject a large number of tags into all of DeepFlow's native and integrated data, so that there are no barriers to data association and no flaws in data drill-down. These tags come from cloud resources, K8s resources, and K8s custom Labels. I believe that developers must like this ability very much, and they no longer need to insert a lot of scattered tags in the business code. We recommend that you inject all the labels that need to be customized through K8s Label when the service goes online, completely decoupled from the business code. As for the dynamic tags related to the business, DeepFlow will also be completely stored in a very efficient way to support retrieval and aggregation.
 Automatically insert so many tags, what about resource consumption? The SmartEncoding mechanism of DeepFlow solves this problem very well. We encode the labels numerically in advance. The indicator data will not carry these labels during generation and transmission, and only the encoded numerical label fields are uniformly inserted before storage. For K8s custom Label, we don't even store it with the indicator data, only associate it at query time. Compared with ClickHouse's LowCard or directly storing tag fields, the SmartEncoding mechanism allows us to reduce computing power and storage consumption by up to an order of magnitude.
Therefore, refusing to insert tags in business code is not only lazy, but also environmentally friendly.
What we want more is to activate team collaboration through extensive data integration and correlation. DeepFlow has automated network and application indicators, Prometheus/Telegraf has automated system performance indicators, plus business indicators exposed by developers through Exporter/StatsD. We deposit these rich indicators into a data platform and perform efficient automatic correlation, hoping to promote the mutual collaboration of operation and maintenance, development, and operation teams, and provide the work efficiency of all teams.
We also have some planned work on metrics integration. We will continue to support the Prometheus remote_read interface, so that DeepFlow can be used as a complete Prometheus remote-storage, which will not change the usage habits of Prometheus users. We plan to export DeepFlow's automated indicators to prometheus-server, so that development teams familiar with Prometheus can easily obtain more powerful panoramic and full-stack indicator alerting capabilities. We are also continuing to support the integration of other agents, and we firmly believe that observability must be able to collect data widely. In addition, DeepFlow also supports the synchronization of information in the service registry, so that the rich information of the application runtime can be automatically injected into the observation data as tags.
Now we enter a new topic - tracking. Let's first feel the AutoTracing capabilities of DeepFlow automation.
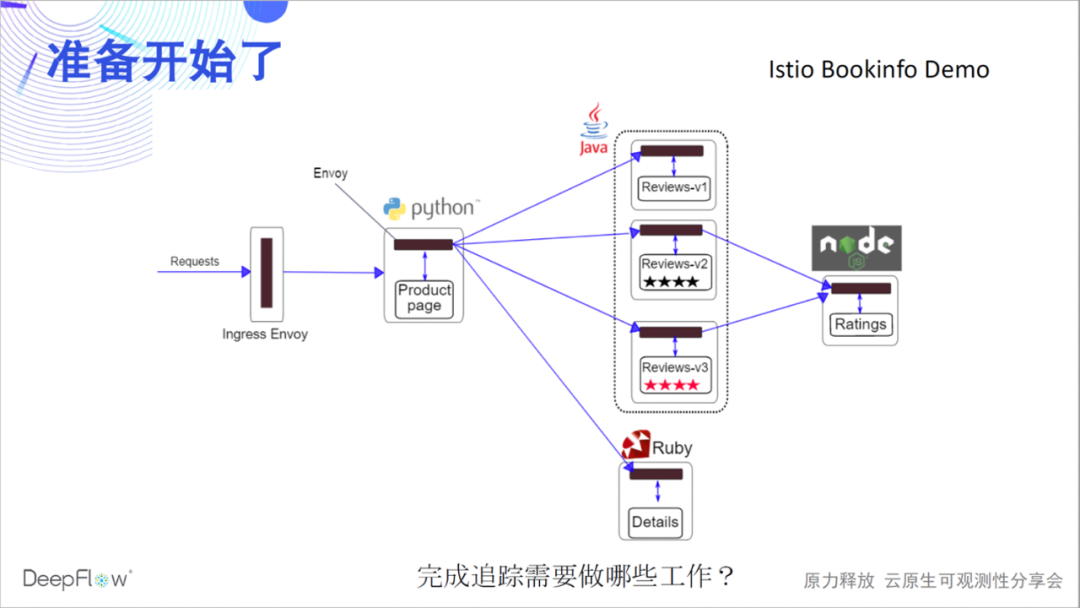
Let's take an Istio official Bookinfo Demo as an example to witness the miracle with you. This Demo is believed to be familiar to many friends. There are 4 microservices in various languages, and there is Envoy Sidecar. Let's guess first, what do we need to do to complete the distributed tracing of it?
Let's take a look at how OpenTelemetry +
Jaeger tracks the demo. You read that right, because there is no instrumentation in this Demo, Jaeger can't see anything, it's empty.
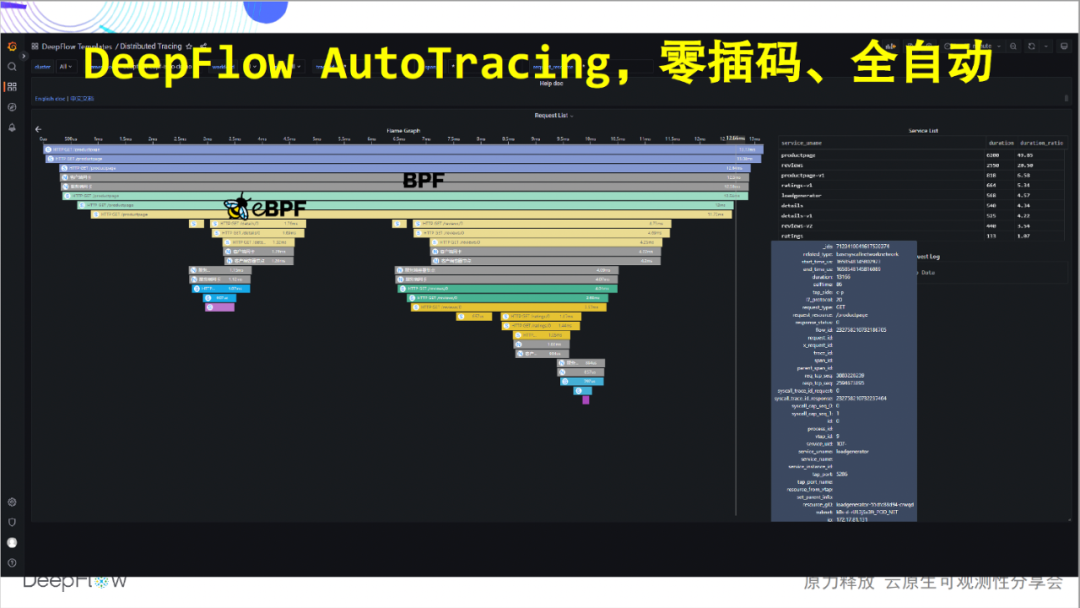
So what does DeepFlow need to do? In fact, nothing needs to be done, because we have already deployed DeepFlow through a helm command early, and no further operations are required. It's time to witness the miracle. Without any code inserted, we completely traced the calls between these four microservices. Rely on eBPF and BPF capabilities, fully automated!
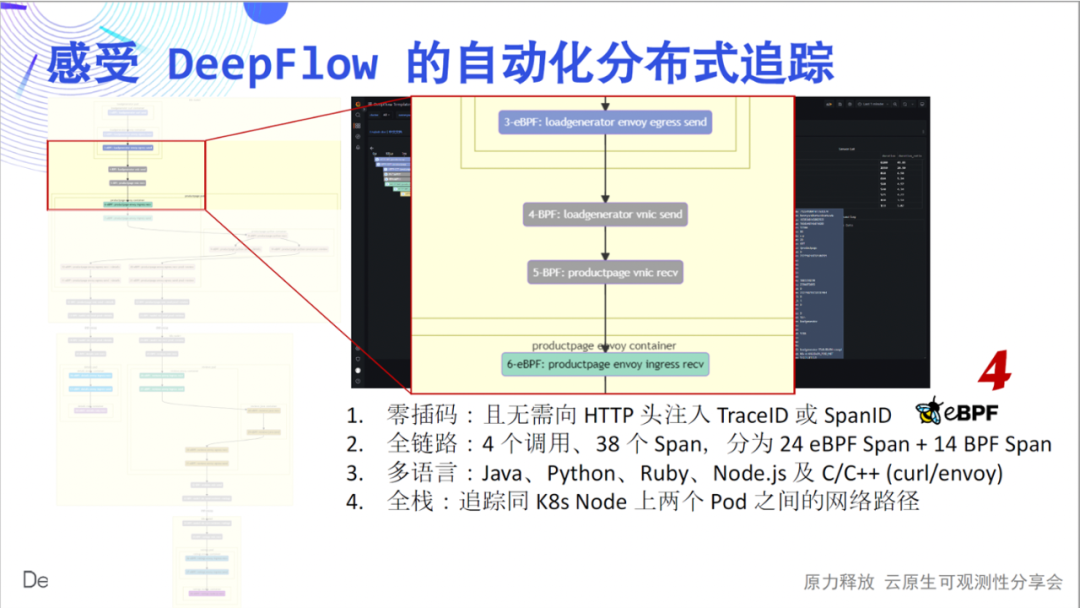
Next, we will take you to experience the profound charm of this simple flame map in detail: zero insertion is the first feeling we want to convey. Drawing each Span of the flame graph as a node, we get a call flow chart, from which we can clearly see the complex calling process of this simple application. The full link is the second feeling we want to convey. In 4 calls, we traced 24 eBPF spans, 14 BPF spans, and constructed their relationships.
Multilingualism is the third feeling we want to convey. The services implemented by Java, Python, Ruby, Node.js, C, and C++ are covered here, and DeepFlow is quietly tracked. Full stack is the fourth feeling we want to convey. We can see that the hop-by-hop network access path between Pods is clear, and where the bottleneck is.
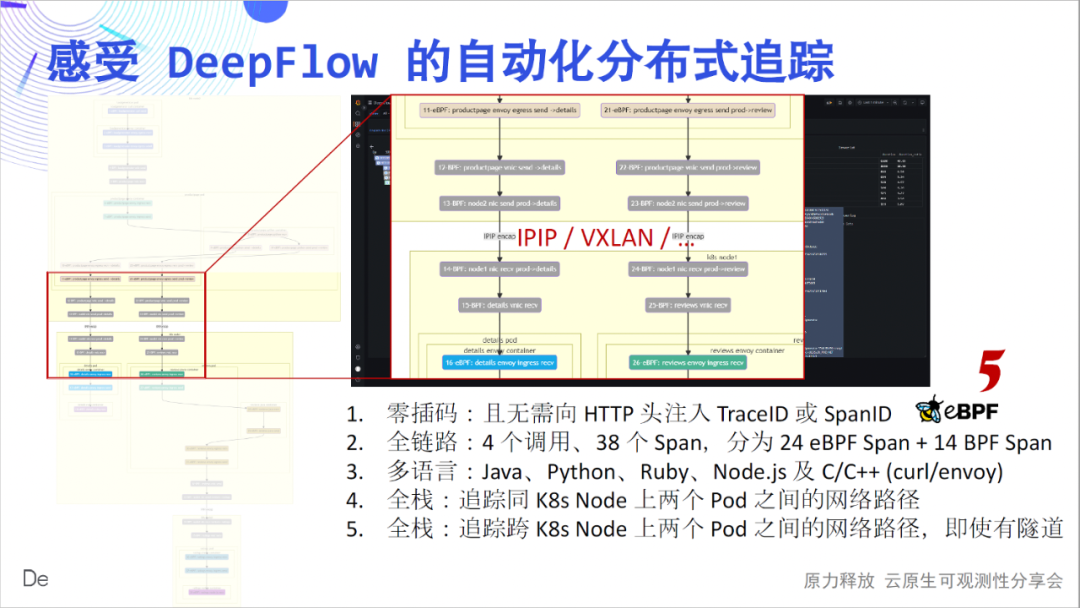
The full stack is also reflected on cross-container nodes. Whether the intermediate network path is IPIP or VXLAN tunnel encapsulation, it can be tracked stably.
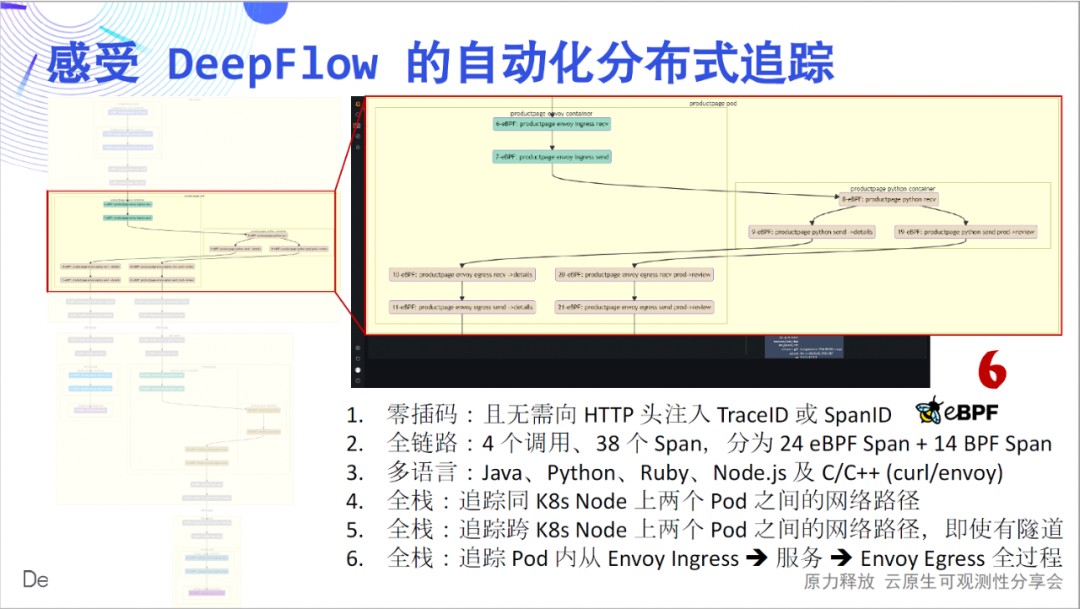
The full stack is also reflected in the traffic path inside the Pod. Are you stuck with a maze of traffic paths when you use Envoy? DeepFlow can easily open the black box of the flow path inside the Pod and see it clearly.

Looking back at the above six points, I believe they are all very cool innovations, and I believe everyone will believe the same. This Demo is also described in detail in our documentation , welcome to experience it.
Since this is an innovative work, there is a high probability that there will be some defects in the initial stage. At present, we have been able to perfectly solve the automatic tracking in blocking IO (BIO) scenarios, as well as the automatic tracking of most load balancing and API gateways (Nginx, HAProxy, Envoy, etc.), which often use non-blocking synchronous IO (NIO). However, all asynchronous IO (AIO) scenarios, such as lightweight threads, coroutines, etc., have not been solved yet. Our work is still in progress, and there has been some good progress. We plan to share with you the dismantling of deep technical principles at QCon 2022 .
AutoTracing is good, but it is difficult to solve the tracking of calls between specified functions within the application. Fortunately, the entire open source community has accumulated more than 10 years in this regard, starting from the foundation of Google Dapper 12 years ago, to the popularity of SkyWalking, and then to the unified standard of OpenTelemetry today. So what kind of combination can DeepFlow have with them?
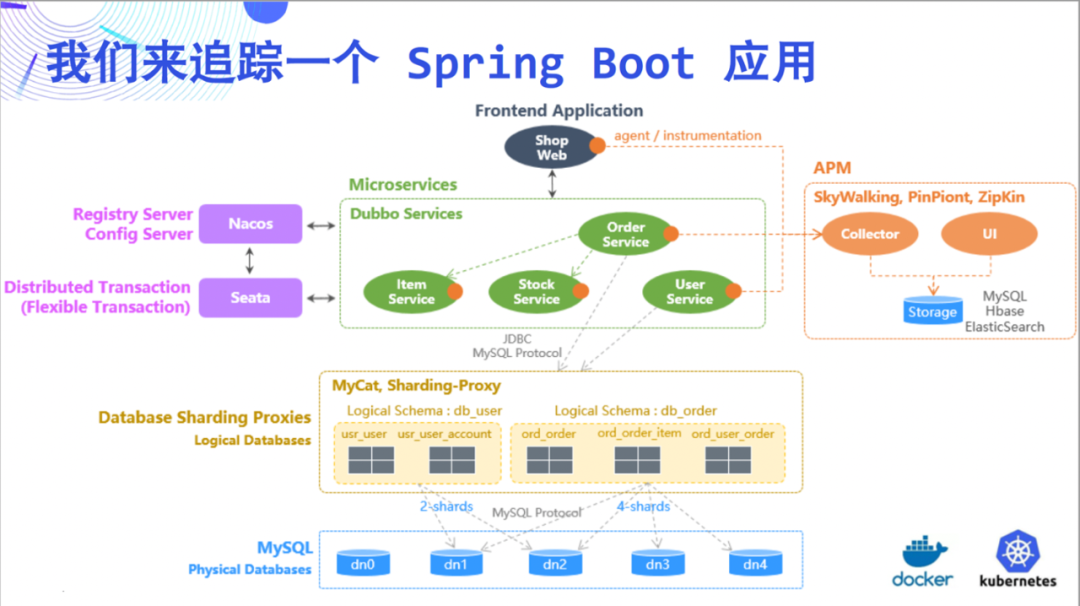
This time, we try to trace a Spring
Boot application as an example to illustrate the amazing capabilities of DeepFlow. This Demo is relatively simple, consisting of 5 microservices and MySQL.
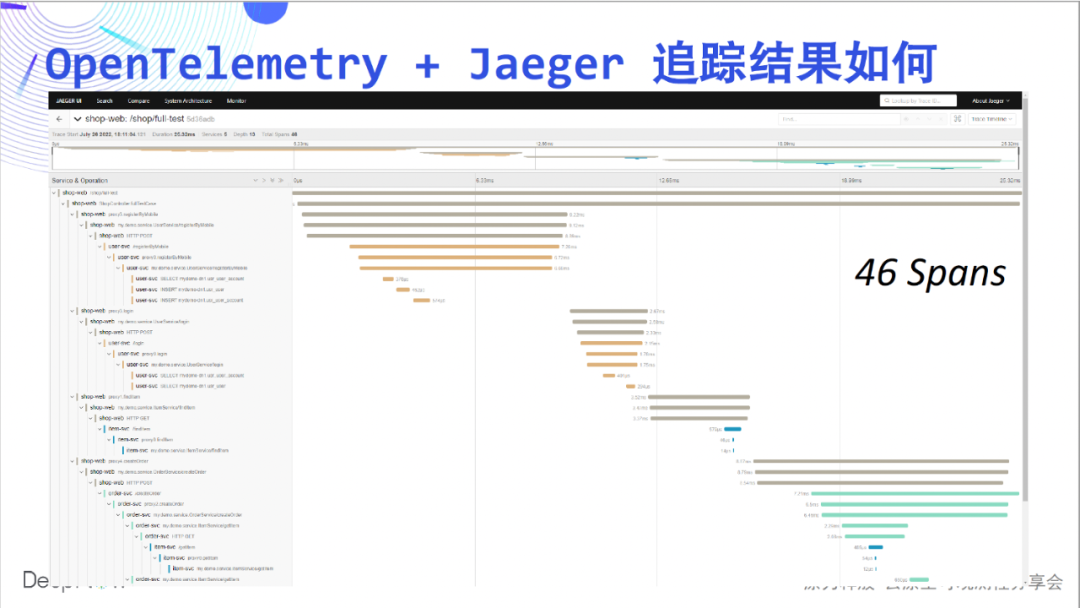
Let's first take a look at the OpenTelemetry +
Jaeger tracking effect, this time it is not empty, 46 Spans are displayed on the page.
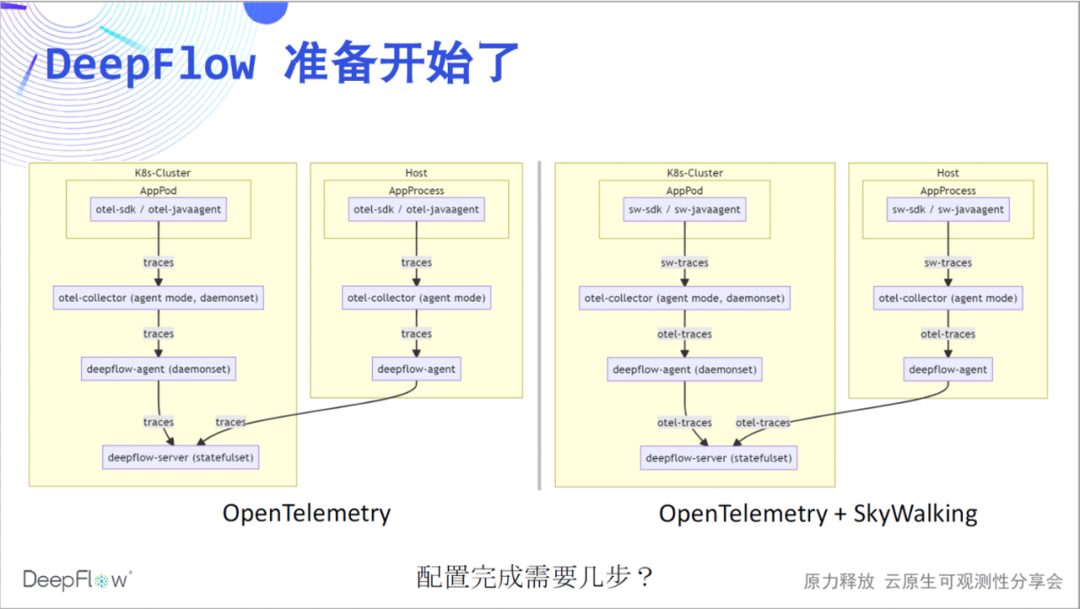
Let's start DeepFlow's performance. We recommend using the agent mode of otel-collector to send traces to deepflow-server via deepflow-agent. Similarly, the integration of SkyWalking data is currently implemented through the otel-collector. You can now guess how many steps we need to complete our configuration work?
Since the live broadcast has been carried out so far, I believe there is no suspense. We can get through OpenTelemetry and DeepFlow in two steps.
otlphttp: traces_endpoint: "http://${HOST_IP}:38086/api/v1/otel/trace" tls: insecure: true retry_on_failure: enabled: true vtap_group_id: <your-agent-group-id> external_agent_http_proxy_enabled: 1 # 默认关闭,零端口监听
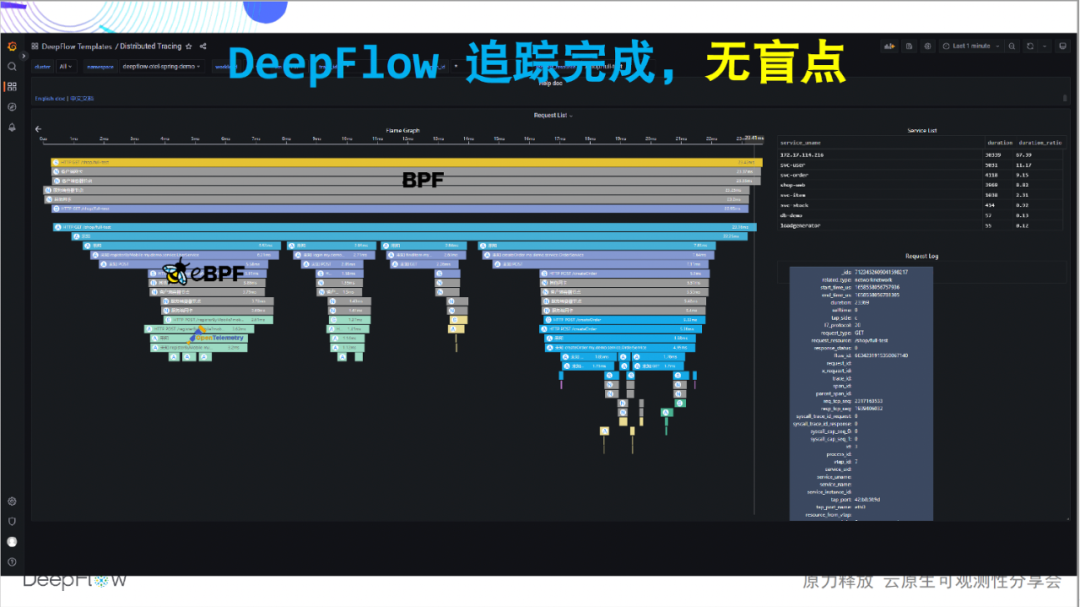
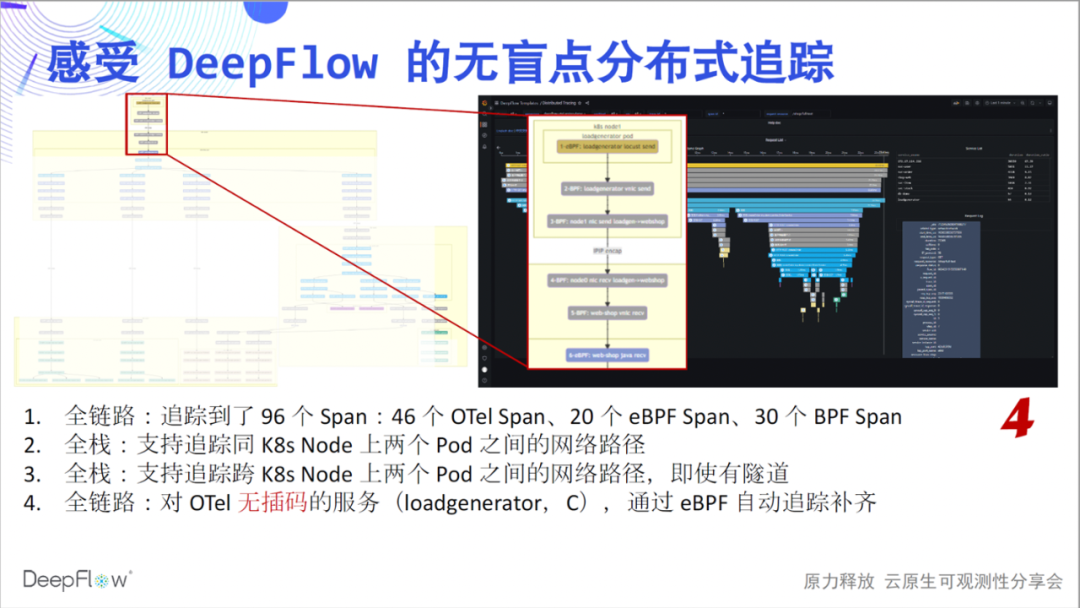
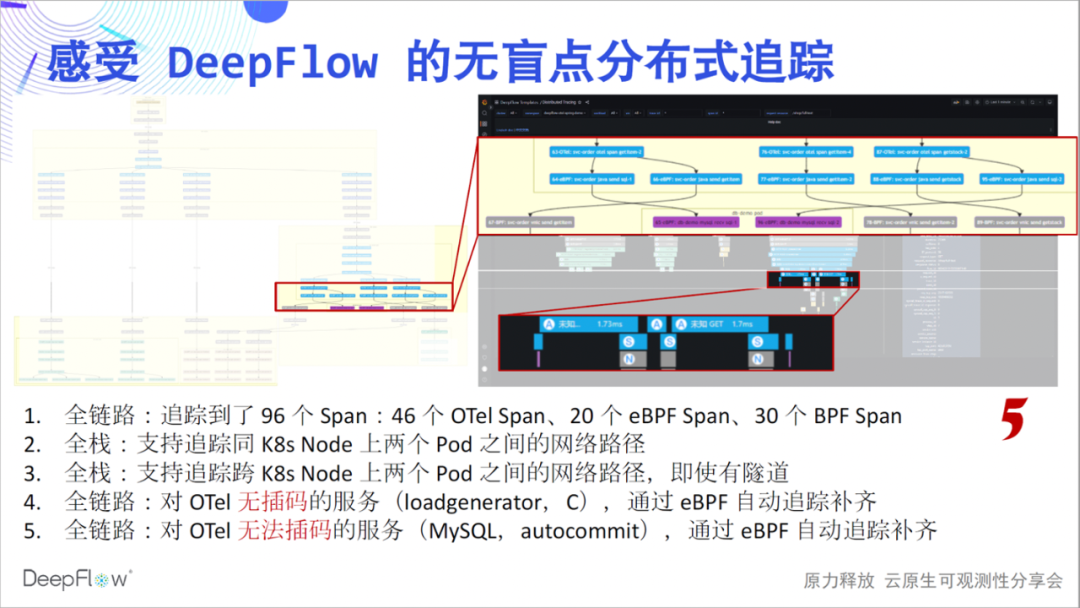
So let's take a look at DeepFlow's integrated tracking capabilities. This flame graph looks flat now, but it has a hidden mystery. Let's slowly uncover its mysterious veil and feel the shock of tracking without blind spots: full link, It's the first feeling we want to convey. Compared with the 46 spans shown by Jaeger, DeepFlow tracked an additional 20 eBPF spans and 30 BPF
spans. We first have a numerical feeling, and we will look at more mysteries layer by layer.
Full stack is the second feeling we want to convey. Our network path tracking ability is still stable, clearly showing the access paths between Pods. The full stack will also be displayed in the cross-node communication scenario at this time, no matter whether there is tunnel encapsulation or not, no matter what tunnel protocol is used.
The whole link, we would like to continue to communicate. Take a closer look at the 6 spans at the top of the picture. This is because the loadgenerator service does not do interpolation, and OpenTelemetry cannot give its tracking path, but using the tracking ability of DeepFlow, 6 eBPF and BPF spans are automatically filled, and the whole process does not need to do anything manually.
Full link, we still want to continue to communicate. Looking at this part of the span in the figure, eBPF automatically found two sets of eBPF spans before and after a series of OTel spans, which are the beginning and end of MySQL transactions, which is very cool. I was wondering what kind of on-site feedback we would get if we could share these capabilities with you through offline activities if there was no epidemic.
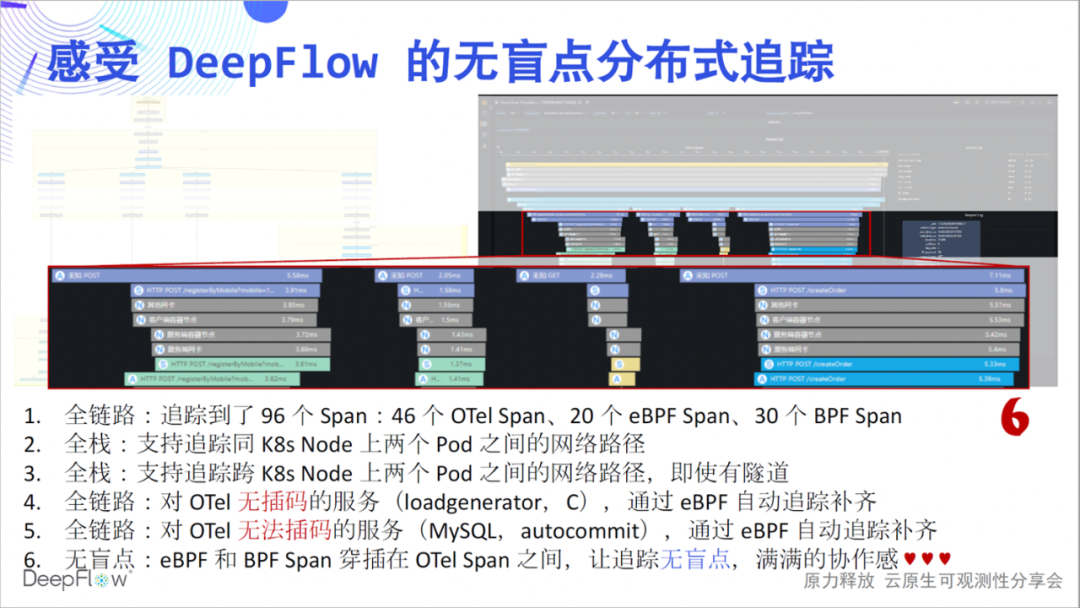
 No blind spot is the sixth feeling we want to convey. Looking at this span in the figure, there is a significant time difference between the client call in the first line and the server response in the last line. At this time, the upstream and downstream teams will usually quarrel, who is the problem. DeepFlow is like a referee, answering the mystery here while talking and laughing. From the figure, we can see that although the latency of OpenTelemetry Span is large near the client, the latency of eBPF Span is significantly reduced, and the cloud-native environment is no longer a black box, which can be seen clearly. I believe that everyone should also feel a full sense of teamwork at this time, and there will be no more quarrels.
 This Demo is also described in detail in our documentation , welcome to experience it. On the other hand, our AutoTagging capabilities also apply to tracking data, and we automatically inject a large number of tags for all spans. We no longer need to configure too many otel-collector
processors for label injection, everything is automatic, high-performance, and environmentally friendly.
And what about SkyWalking. At present, we can solve the integration of SkyWalking data in three steps. Although there is one more step, I believe that compared with the above shock, everyone will not think it is very troublesome. Please refer to our documentation to get started.
receivers: skywalking: protocols: grpc: endpoint: 0.0.0.0:11800 http: endpoint: 0.0.0.0:12800 service: pipelines: traces: receivers: [skywalking] spec: ports: - name: sw-http port: 12800 protocol: TCP targetPort: 12800 - name: sw-grpc port: 11800 protocol: TCP targetPort: 11800 vtap_group_id: <your-agent-group-id> external_agent_http_proxy_enabled: 1 # required
Likewise, our multi-cluster, heterogeneous environment monitoring capabilities are still ready for tracking scenarios, and the entire data platform still scales horizontally without the need for external components.
Yes, we still have a series of future jobs. Including direct integration of SkyWalking data without otel-collector, including integration of Sentry data to unlock RUM capability. At present, our tracking data is displayed through the Grafana Panel implemented by ourselves. I think it should be a good idea to connect with Tempo.
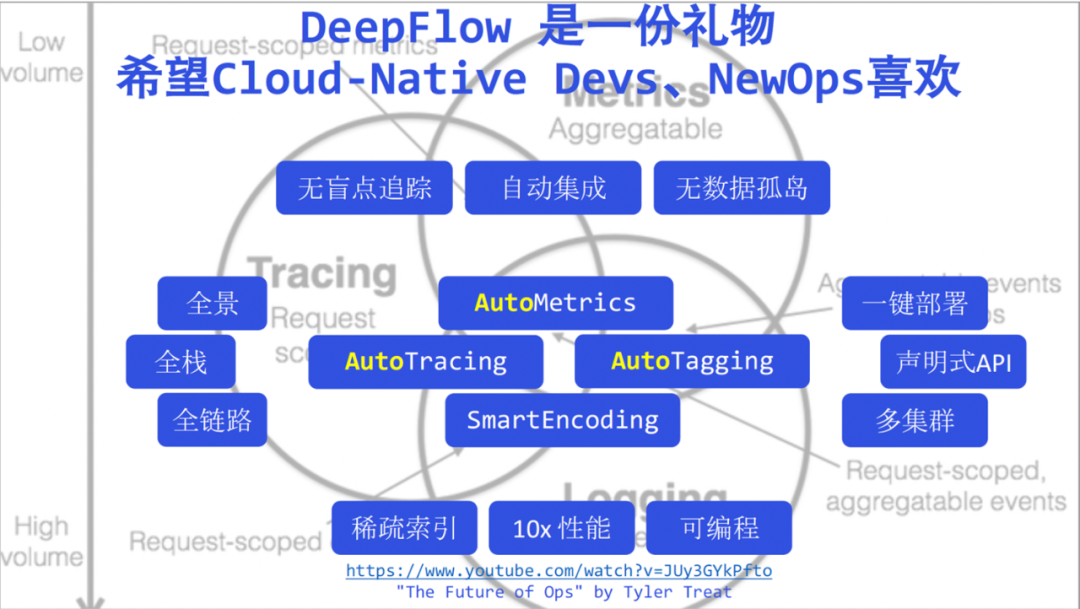
Finally, as a review, we will pile up the DeepFlow keywords mentioned today, and I will not emphasize these weak keywords one by one here. Now I say that DeepFlow has brought observability into a new era of high automation, I believe you will no longer have any doubts. We believe DeepFlow is a gift to developers and operators in the new era.
We hope that developers can have more time to focus on business, hand over more observability to automated DeepFlow, and make their code cleaner and tidy. Below this picture, I attached Tyler Treat's speech - The Future of Ops . Tyler explained the challenges and opportunities of Ops in the cloud native era a few years ago. I will share it with the operation and maintenance students. Here I also pay tribute to Tyler, and I also believe that DeepFlow can be liked by Ops in the new era.
You may be wondering why we didn't talk about logs today. DeepFlow has done some work in this area, but it has always been in awe of this field. Next month, we will introduce the current status and plans of DeepFlow in terms of logs together with the cloud native community and Alibaba Cloud iLogTail. You are welcome to pay attention.
We want to build a world-class open source observability platform. There is still a long way to go, just like climbing Mount Everest. If the current DeepFlow version number is translated into altitude, it may correspond exactly between Camp 2 and Camp 3. See you at the top of 8848! thank you all!
Go to the DeepFlow warehouse address!
Bilibili , Transaction Guarantee , Buy with Confidence , DeepFlow
- Mini Programs thatOpen a New Era of Highly Automated Observability
