
[CSDN Editor's Note] The author of this article uses an example program to demonstrate the performance optimization process of reading and writing data through Linux pipes, increasing the throughput from the initial 3.5GiB/s to the final 65GiB/s. Even if it is just a small example, it involves a lot of knowledge points, including zero-copy operations, ring buffers, paging and virtual memory, synchronization overhead, etc., especially for concepts such as splicing, paging, and virtual memory address mapping in the Linux kernel Analyzed from the source level. From the concept to the code, the article progresses from shallow to deep, layer by layer. Although it focuses on the optimization of pipeline read and write performance, I believe that developers of high-performance applications or Linux kernel will benefit a lot from it.
Original link: https://mazzo.li/posts/fast-pipes.html
Note: This article is translated by CSDN organization, unauthorized reprinting is prohibited!
This article investigates how Unix pipes are implemented in Linux by iterative optimization of a test program that writes and reads data through pipes.
We started with a simple program with a throughput of about 3.5GiB/s and gradually increased its performance by a factor of 20. The performance improvement was confirmed by using the perf tooling profiler for Linux, the code is available on GitHub (https://github.com/bitonic/pipes-speed-test).
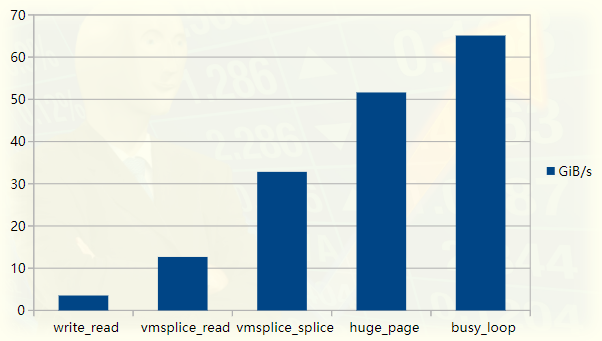
Pipeline Tester Performance Graph
This article was inspired by reading a highly optimized FizzBuzz program. On my laptop, the program pushes output into a pipe at about 35GiB/s. Our first goal is to achieve this speed and will describe each step in the optimization process. An additional performance improvement that is not needed in FizzBuzz will be added later, since the bottleneck is actually compute output, not IO, at least on my machine.
We will proceed as follows:
-
The first is a slow version of the pipeline benchmark;
-
Explain how the pipeline is implemented internally, and why reading and writing from it is slow;
-
Explain how to use the vmsplice and splice system calls to bypass some (but not all!) slownesses;
-
Explain Linux paging, and use huge pages to implement a fast version;
-
Replace polling with a busy loop for final optimization;
-
Summarize
Step 4 is the most important part of the Linux kernel, so it may be of interest even if you are familiar with the other topics discussed in this article. For readers unfamiliar with the subject, we assume that you only know the basics of the C language.

Challenge the first slow version
Let's first test the performance of the legendary FizzBuzz program according to StackOverflow's posting rules :
% ./fizzbuzz | pv >/dev/null422GiB 0:00:16 [36.2GiB/s]
pv stands for "pipe viewer" and is a handy tool for measuring the throughput of data flowing through a pipe . Shown is fizzbuzz producing output at 36GiB/s.
fizzbuzz writes output in chunks as large as the L2 cache to strike a good balance between cheap memory access and minimal IO overhead.
On my machine, the L2 cache is 256KiB. This article also outputs 256KiB blocks, but does not do any "calculation". We essentially want to measure an upper bound on the throughput of a program writing to a pipe with a reasonable buffer size.
fizzbuzz uses pv to measure speed, and our setup will be slightly different: we'll execute programs on both ends of the pipe, so we have full control over the code involved in pushing and pulling data from the pipe.
The code is available in my pipes-speed-test rep . write.cpp implements writing, and read.cpp implements reading. write keeps writing the same 256KiB repeatedly, read terminates after reading 10GiB of data, and prints the throughput in GiB/s. Both executable programs accept various command line options to change their behavior.
The first test of reading and writing from the pipe will use the write and read system calls, using the same buffer size as fizzbuzz. The write-side code is shown below:
int main() {size_t buf_size = 1 << 18; // 256KiBchar* buf = (char*) malloc(buf_size);memset((void*)buf, 'X', buf_size); // output Xswhile (true) {size_t remaining = buf_size;while (remaining > 0) {// Keep invoking `write` until we've written the entirety// of the buffer. Remember that write returns how much// it could write into the destination -- in this case,// our pipe.ssize_t written = write(STDOUT_FILENO, buf + (buf_size - remaining), remaining);remaining -= written;}}}
For the sake of brevity, all error checking is omitted in this and subsequent code snippets. In addition to ensuring that the output is printable, memset serves another purpose, which we will discuss later.
All the work is done with the write call, the rest is making sure the entire buffer is written. The read side is very similar, just reads data into buf and terminates when enough data has been read.
Once built, the code in the repository can be run as follows:
./write | ./read3.7GiB/s, 256KiB buffer, 40960 iterations (10GiB piped)
We write to the same 256KiB buffer filled with 40960 "X" times and measure throughput. Annoyingly, it's 10 times slower than fizzbuzz! We just write bytes to the pipe and do nothing else. It turns out that we can't get much faster than this by using write and read.

write problem
To find out what time is spent running the program, we can use perf:
% perf record -g sh -c './write | ./read'3.2GiB/s, 256KiB buffer, 40960 iterations (10GiB piped)[ perf record: Woken up 6 times to write data ][ perf record: Captured and wrote 2.851 MB perf.data (21201 samples) ]
The -g option instructs perf to log the call graph: this allows us to see where the time is spent from top to bottom.
We can use perf report to see where time is spent. Here's a slightly edited snippet detailing the time spent writing:
% perf report -g --symbol-filter=write- 48.05% 0.05% write libc-2.33.so [.] __GI___libc_write- 48.04% __GI___libc_write- 47.69% entry_SYSCALL_64_after_hwframe- do_syscall_64- 47.54% ksys_write- 47.40% vfs_write- 47.23% new_sync_write- pipe_write+ 24.08% copy_page_from_iter+ 11.76% __alloc_pages+ 4.32% schedule+ 2.98% __wake_up_common_lock0.95% _raw_spin_lock_irq0.74% alloc_pages0.66% prepare_to_wait_event
47% of the time is spent on pipe_write, which is what write does when we write to the pipe. This is not surprising - we spent about half the time writing and the other half reading.
In pipe_write, 3/4 of the time is spent copying or allocating pages (copy_page_from_iter and __alloc_page). This makes some sense if we already have an idea of how the communication between the kernel and user space works. Either way, to fully understand what's going on, we must first understand how pipes work.

What are pipes made of?
The data structures that define the pipes can be found in include/linux/pipe_fs_i.h, and operations on them are in fs/pipe.c.
A Linux pipe is a ring buffer that holds references to pages where data is written and read:
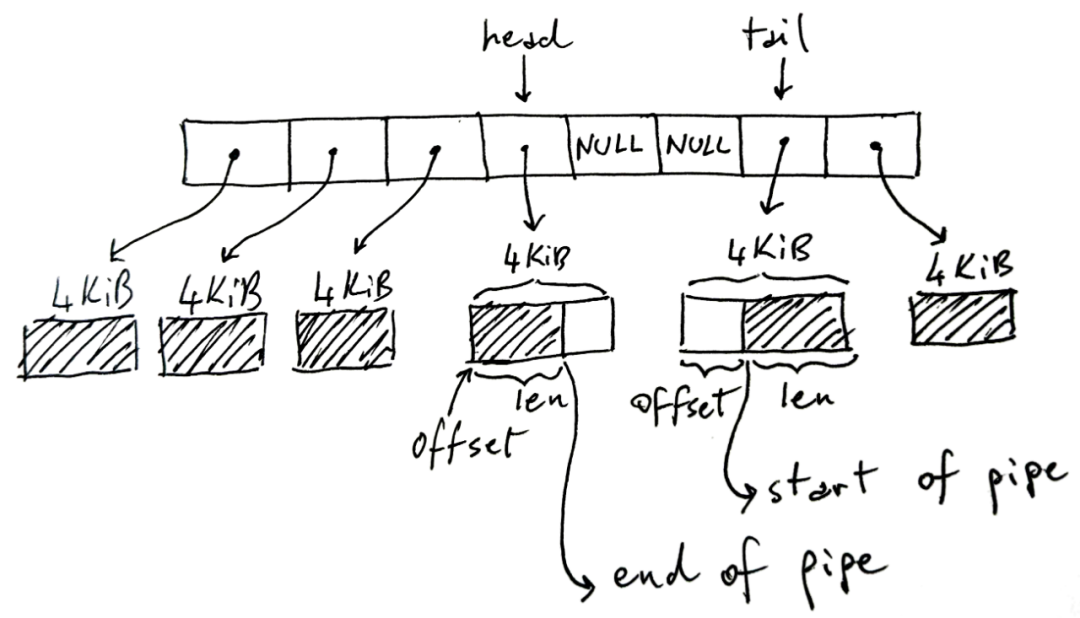
The ring buffer in the picture above has 8 slots, but it may be more or less, and the default is 16. Each page size is 4KiB on the x86-64 architecture, but may vary on other architectures. The pipe can hold a total of 32KiB of data. Here's a key point: every pipe has an upper limit on the total amount of data it can hold before it fills up.
The shaded part in the figure represents the current pipeline data, and the non-shaded part represents the free space in the pipeline.
Somewhat counterintuitively, head stores the write end of the pipeline. That is, the writer will write to the buffer pointed to by head, increasing head accordingly if it needs to move to the next buffer. In the write buffer, len stores how much we have written in it.
Instead, tail stores the read end of the pipe: the reader will start using the pipe from there. offset indicates where to start reading.
Note that the tail can appear after the head, as shown in the image, since we are using a circular/ring buffer. Also note that when we don't completely fill the pipe, some slots may not be used - NULL cells in the middle. If the pipe is full (there are no NULLs and free space in the page), the write will block. If the pipe is empty (all NULLs), read will block.
The following is an abridged version of the C data structure in pipe_fs_i.h:
struct pipe_inode_info {unsigned int head;unsigned int tail;struct pipe_buffer *bufs;};struct pipe_buffer {struct page *page;unsigned int offset, len;};
We've omitted many fields here, and haven't explained what's in the struct page, but it's a key data structure for understanding how to read and write from a pipe.

read and write pipes
Now let's go back to the definition of pipe_write and try to understand the perf output shown earlier. A brief description of how pipe_write works is as follows:
1. If the pipeline is full, wait for space and restart;
2. If the buffer currently pointed to by head has space, fill the space first ;
3. When there are free slots and there are remaining bytes to write , new pages are allocated and filled , updating the head.
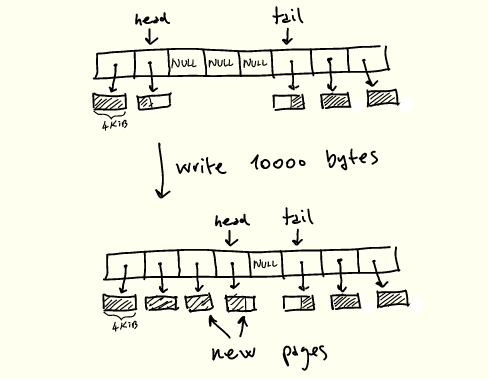
Action when writing to the pipe
The above operations are protected by a lock that pipe_write acquires and releases as needed .
pipe_read is a mirror of pipe_write, the difference is that the page is consumed, released after the page is completely read, and the tail is updated.
So the current process creates a very unpleasant situation:
-
Each page is copied twice, once from user memory to kernel and once from kernel to user memory;
-
Copies a 4KiB page at a time, intertwined with other operations such as synchronization between reads and writes, page allocation and deallocation;
-
The memory being processed may not be contiguous due to the constant allocation of new pages;
-
Pipe locks need to be acquired and released all the time during processing.
On this machine, sequential RAM reads are about 16GiB/s:
sysbench memory --memory-block-size=1G --memory-oper=read --threads=1 run...102400.00 MiB transferred (15921.22 MiB/sec)
Considering all the issues listed above, it's not surprising that it's 4x slower compared to single-threaded sequential RAM speeds.
Adjusting buffer or pipe sizes to reduce system call and synchronization overhead, or adjusting other parameters won't help much. Fortunately, there is a way to avoid slow read and write altogether.

Improve with stitching
This copying of buffers from user memory to the kernel and back is a common thorn in the side of people who need fast IO. A common solution is to remove kernel operations from processing and perform IO operations directly. For example, we can interact directly with the network card and network with low latency bypassing the kernel.
Usually when we write to a socket, file or pipe in this case, we first write to some buffer in the kernel and then let the kernel do its work. In the case of pipes, a pipe is a series of buffers in the kernel. All this duplication is not desirable if we care about performance.
Luckily, Linux includes system calls to speed things up without copying when we want to move data around a pipe. in particular:
-
splice moves data from pipes to file descriptors and vice versa;
-
vmsplice moves data from user memory into the pipe.
The point is, both operations work without copying anything.
Now that we know how pipes work, we can roughly imagine how these two operations work: they just "grab" an existing buffer from somewhere and put it into the pipe ring buffer, or vice versa Come over, instead of allocating new pages when needed:
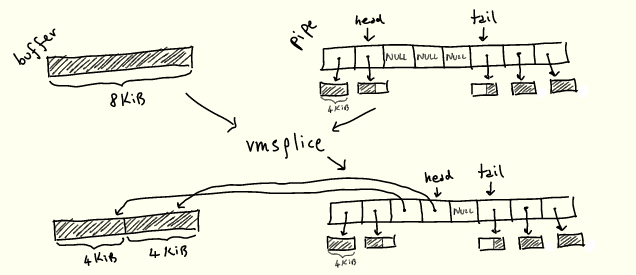
We'll see how it works soon.

Splicing implementation
We replace write with vmsplice. The vmsplice signature is as follows:
struct iovec {void *iov_base; // Starting addresssize_t iov_len; // Number of bytes};// Returns how much we've spliced into the pipessize_t vmsplice(int fd, const struct iovec *iov, size_t nr_segs, unsigned int flags);
fd is the destination pipe and struct iovec *iov is the array of buffers that will be moved to the pipe. Note that vmsplice returns the quantity "spliced" into the pipe, which may not be the full quantity, just as write returns the quantity written. Don't forget that pipes are limited by the number of slots they can have in the ring buffer, while vmsplice is not.
You also need to be careful when using vmsplice. User memory is moved into the pipe without copying, so you must ensure that the read side uses it before reusing the stitched buffer.
For this, fizzbuzz uses a double buffering scheme, which works as follows:
-
Divide the 256KiB buffer into two;
-
Setting the pipe size to 128KiB is equivalent to setting the pipe's ring buffer to have 128KiB/4KiB=32 slots;
-
Choose between writing the first half of the buffer or using vmsplice to move it into the pipe, and do the same for the other half.
The pipe size is set to 128KiB, and waiting for vmsplice to fully output a 128KiB buffer ensures that when a vmsplic iteration completes, we know the previous buffer has been fully read - otherwise the new 128KiB buffer cannot be fully read vmsplice into a 128KiB pipe.
Now, we haven't actually written anything to the buffer, but we'll keep the double-buffering scheme since any program that actually writes something needs a similar scheme.
Our write loop now looks like this:
int main() {size_t buf_size = 1 << 18; // 256KiBchar* buf = malloc(buf_size);memset((void*)buf, 'X', buf_size); // output Xschar* bufs[2] = { buf, buf + buf_size/2 };int buf_ix = 0;// Flip between the two buffers, splicing until we're done.while (true) {struct iovec bufvec = {.iov_base = bufs[buf_ix],.iov_len = buf_size/2};buf_ix = (buf_ix + 1) % 2;while (bufvec.iov_len > 0) {ssize_t ret = vmsplice(STDOUT_FILENO, &bufvec, 1, 0);bufvec.iov_base = (void*) (((char*) bufvec.iov_base) + ret);bufvec.iov_len -= ret;}}}
Here is the result of writing using vmsplice instead of write:
./write --write_with_vmsplice | ./read12.7GiB/s, 256KiB buffer, 40960 iterations (10GiB piped)
This halved the amount of replication we needed and more than tripled the throughput to 12.7GiB/s. After changing the read side to use splice, all the copying was eliminated, giving another 2.5x speedup:
./write --write_with_vmsplice | ./read --read_with_splice32.8GiB/s, 256KiB buffer, 40960 iterations (10GiB piped)

page improvements
what's next? Let's ask perf:
% perf record -g sh -c './write --write_with_vmsplice | ./read --read_with_splice'33.4GiB/s, 256KiB buffer, 40960 iterations (10GiB piped)[ perf record: Woken up 1 times to write data ][ perf record: Captured and wrote 0.305 MB perf.data (2413 samples) ]% perf report --symbol-filter=vmsplice- 49.59% 0.38% write libc-2.33.so [.] vmsplice- 49.46% vmsplice- 45.17% entry_SYSCALL_64_after_hwframe- do_syscall_64- 44.30% __do_sys_vmsplice+ 17.88% iov_iter_get_pages+ 16.57% __mutex_lock.constprop.03.89% add_to_pipe1.17% iov_iter_advance0.82% mutex_unlock0.75% pipe_lock2.01% __entry_text_start1.45% syscall_return_via_sysret
Most of the time is spent locking the pipe for writing (__mutex_lock.constprop.0) and moving pages into the pipe (iov_iter_get_pages). Not much can be improved about locking, but we can improve the performance of iov_iter_get_pages.
As the name suggests, iov_iter_get_pages converts the struct iovecs we provide to vmsplice into struct pages to put into the pipeline. In order to understand what this function actually does, and how to speed it up, we must first understand how the CPU and Linux organize pages.

A quick look at pagination
As you know, processes don't directly reference locations in RAM: instead they allocate virtual memory addresses, which are resolved to physical addresses. This abstraction is called virtual memory , and we won't cover its various advantages here - but most notably, it greatly simplifies running multiple processes competing for the same physical memory.
In any case, whenever we execute a program and load/store from memory to memory, the CPU needs to translate virtual addresses to physical addresses. It is impractical to store a mapping from every virtual address to every corresponding physical address. Therefore, memory is divided into uniformly sized blocks called pages, and virtual pages are mapped to physical pages:
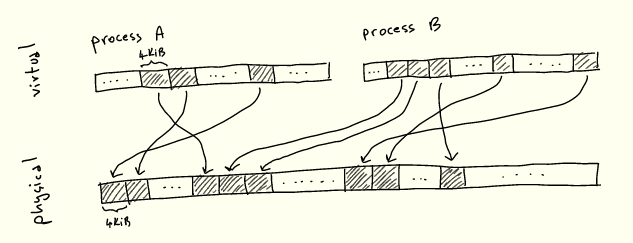
There's nothing special about 4KiB: each architecture chooses a size based on various tradeoffs - we'll explore some of these shortly.
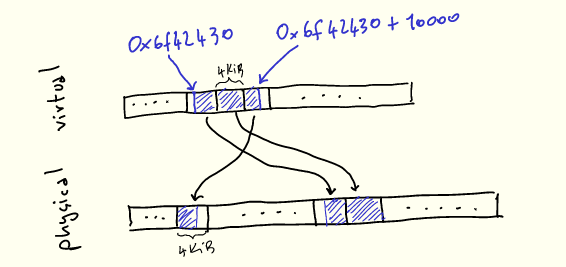
To make this more explicit, let's imagine using malloc to allocate 10000 bytes:
void* buf = malloc(10000);printf("%p\n", buf); // 0x6f42430
When we use them, our 10k bytes will appear contiguous in virtual memory, but will be mapped to 3 physical pages that don't have to be contiguous:
内核的任务之一是管理此映射,这体现在称为页表的数据结构中。CPU 指定页表结构(因为它需要理解页表),内核根据需要对其进行操作。在 x86-64 架构上,页表是一个 4 级 512 路的树,本身位于内存中。 该树的每个节点是(你猜对了!)4KiB 大小,节点内指向下一级的每个条目为 8 字节(4KiB/8bytes = 512)。这些条目包含下一个节点的地址以及其他元数据。
每个进程都有一个页表——换句话说,每个进程都保留了一个虚拟地址空间。当内核上下文切换到进程时,它将特定寄存器 CR3 设置为该树根的物理地址。然后,每当需要将虚拟地址转换为物理地址时,CPU 将该地址拆分成若干段,并使用它们遍历该树,以及计算物理地址。
为了减少这些概念的抽象性,以下是虚拟地址 0x0000f2705af953c0 如何解析为物理地址的直观描述:
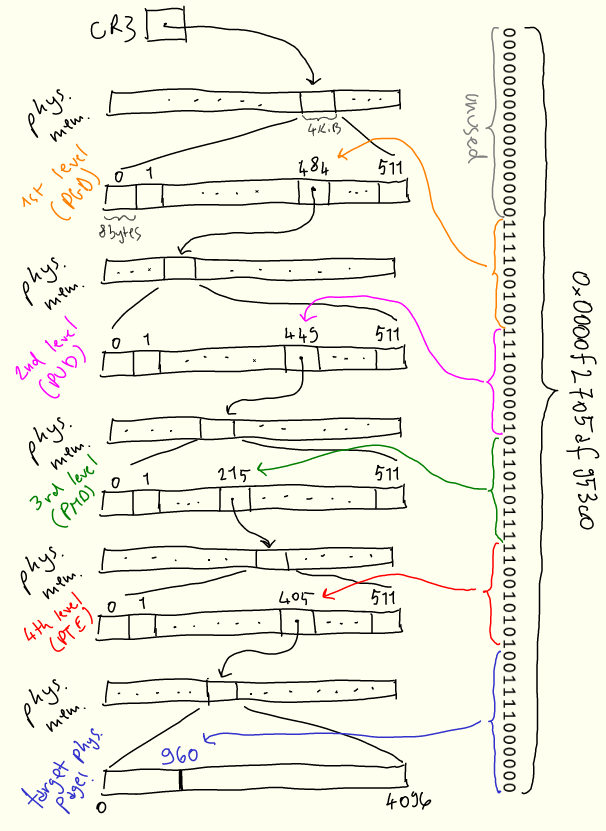
搜索从第一级开始,称为“page global directory”,或 PGD,其物理位置存储在 CR3 中。地址的前 16 位未使用。 我们使用接下来的 9 位 PGD 条目,并向下遍历到第二级“page upper directory”,或 PUD。接下来的9位用于从 PUD 中选择条目。该过程在下面的两个级别上重复,即 PMD(“page middle directory”)和 PTE(“page table entry”)。PTE 告诉我们要查找的实际物理页在哪里,然后我们使用最后12位来查找页内的偏移量。
页面表的稀疏结构允许在需要新页面时逐步建立映射。每当进程需要内存时,内核将用新条目更新页表。

struct page 的作用
struct page 数据结构是这种机制的关键部分:它是内核用来引用单个物理页、存储其物理地址及其各种其他元数据的结构。例如,我们可以从 PTE 中包含的信息(上面描述的页表的最后一级)中获得 struct page。一般来说,它被广泛用于处理页面相关事务的所有代码。
在管道场景下,struct page 用于将其数据保存在环形缓冲区中,正如我们已经看到的:
struct pipe_inode_info {unsigned int head;unsigned int tail;struct pipe_buffer *bufs;};struct pipe_buffer {struct page *page;unsigned int offset, len;};
然而,vmsplice 接受虚拟内存作为输入,而 struct page 直接引用物理内存。
因此我们需要将任意的虚拟内存块转换成一组 struct pages。这正是 iov_iter_get_pages 所做的,也是我们花费一半时间的地方:
ssize_t iov_iter_get_pages(struct iov_iter *i, // input: a sized buffer in virtual memorystruct page **pages, // output: the list of pages which back the input bufferssize_t maxsize, // maximum number of bytes to getunsigned maxpages, // maximum number of pages to getsize_t *start // offset into first page, if the input buffer wasn't page-aligned);
struct iov_iter 是一种 Linux 内核数据结构,表示遍历内存块的各种方式,包括 struct iovec。在我们的例子中,它将指向 128KiB 的缓冲区。vmsplice 使用 iov_iter_get_pages 将输入缓冲区转换为一组 struct pages,并保存它们。既然已经知道了分页的工作原理,你可以大概想象一下 iov_iter_get_pages 是如何工作的,下一节详细解释它。
我们已经快速了解了许多新概念,概括如下:
-
现代 CPU 使用虚拟内存进行处理;
-
内存按固定大小的页面进行组织;
-
CPU 使用将虚拟页映射到物理页的页表,把虚拟地址转换为物理地址;
-
内核根据需要向页表添加和删除条目;
-
管道是由对物理页的引用构成的,因此 vmsplice 必须将一系列虚拟内存转换为物理页,并保存它们。

获取页的成本
在 iov_iter_get_pages 中所花费的时间,实际上完全花在另一个函数,get_user_page_fast 中:
perf report -g --symbol-filter=iov_iter_get_pages- 17.08% 0.17% write [kernel.kallsyms] [k] iov_iter_get_pages- 16.91% iov_iter_get_pages- 16.88% internal_get_user_pages_fast11.22% try_grab_compound_head
get_user_pages_fast 是 iov_iter_get_ pages 的简化版本:
int get_user_pages_fast(// virtual address, page alignedunsigned long start,// number of pages to retrieveint nr_pages,// flags, the meaning of which we won't get intounsigned int gup_flags,// output physical pagesstruct page **pages)
这里的“user”(与“kernel”相对)指的是将虚拟页转换为对物理页的引用。
为了得到 struct pages,get_user_pages_fast 完全按照 CPU 操作,但在软件中:它遍历页表以收集所有物理页,将结果存储在 struct pages 里。我们的例子中是一个 128KiB 的缓冲区和 4KiB 的页,因此 nr_pages = 32。get_user_page_fast 需要遍历页表树,收集 32 个叶子,并将结果存储在 32 个 struct pages 中。
get_user_pages_fast 还需要确保物理页在调用方不再需要之前不会被重用。这是通过在内核中使用存储在 struct page 中的引用计数来实现的,该计数用于获知物理页在将来何时可以释放和重用。get_user_pages_fast 的调用者必须在某个时候使用 put_page 再次释放页面,以减少引用计数。
最后,get_user_pages_fast 根据虚拟地址是否已经在页表中而表现不同。这就是 _fast 后缀的来源:内核首先将尝试通过遍历页表来获取已经存在的页表条目和相应的 struct page,这成本相对较低,然后通过其他更高成本的方法返回生成 struct page。我们在开始时memset内存的事实,将确保永远不会在 get_user_pages_fast 的“慢”路径中结束,因为页表条目将在缓冲区充满“X”时创建。
注意,get_user_pages 函数族不仅对管道有用——实际上它在许多驱动程序中都是核心。一个典型的用法与我们提及的内核旁路有关:网卡驱动程序可能会使用它将某些用户内存区域转换为物理页,然后将物理页位置传递给网卡,并让网卡直接与该内存区域交互,而无需内核参与。

大体积页面
到目前为止,我们所呈现的页大小始终相同——在 x86-64 架构上为 4KiB。但许多 CPU 架构,包括 x86-64,都包含更大的页面尺寸。x86-64 的情况下,我们不仅有 4KiB 的页(“标准”大小),还有 2MiB 甚至 1GiB 的页(“巨大”页)。在本文的剩余部分中,我们只讨论2MiB的大页,因为 1GiB 的页相当少见,对于我们的任务来说纯属浪费。
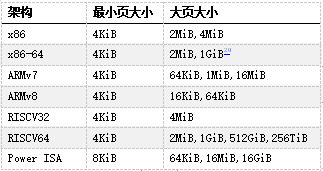
当今常用架构中的页大小,来自维基百科
大页的主要优势在于管理成本更低,因为覆盖相同内存量所需的页更少。此外其他操作的成本也更低,例如将虚拟地址解析为物理地址,因为所需要的页表少了一级:以一个 21 位的偏移量代替页中原来的12位偏移量,从而少一级页表。
这减轻了处理此转换的 CPU 部分的压力,因而在许多情况下提高了性能。但是在我们的例子中,压力不在于遍历页表的硬件,而在内核中运行的软件。
在 Linux 上,我们可以通过多种方式分配 2MiB 大页,例如分配与 2MiB 对齐的内存,然后使用 madvise 告诉内核为提供的缓冲区使用大页:
void* buf = aligned_alloc(1 << 21, size);madvise(buf, size, MADV_HUGEPAGE)
切换到大页又给我们的程序带来了约 50% 的性能提升:
./write --write_with_vmsplice --huge_page | ./read --read_with_splice51.0GiB/s, 256KiB buffer, 40960 iterations (10GiB piped)
然而,提升的原因并不完全显而易见。我们可能会天真地认为,通过使用大页, struct page 将只引用 2MiB 页,而不是 4KiB 页面。
遗憾的是,情况并非如此:内核代码假定 struct page 引用当前架构的“标准”大小的页。这种实现作用于大页(通常Linux称之为“复合页面”)的方式是,“头” struct page 包含关于背后物理页的实际信息,而连续的“尾”页仅包含指向头页的指针。
因此为了表示 2MiB 的大页,将有1个“头”struct page,最多 511 个“尾”struct pages。或者对于我们的 128KiB 缓冲区来说,有 31个尾 struct pages:

即使我们需要所有这些 struct pages,最后生成它的代码也会大大加快。找到第一个条目后,可以在一个简单的循环中生成后面的 struct pages,而不是多次遍历页表。这样就提高了性能!

Busy looping
我们很快就要完成了,我保证!再看一下 perf 的输出:
- 46.91% 0.38% write libc-2.33.so [.] vmsplice- 46.84% vmsplice- 43.15% entry_SYSCALL_64_after_hwframe- do_syscall_64- 41.80% __do_sys_vmsplice+ 14.90% wait_for_space+ 8.27% __wake_up_common_lock4.40% add_to_pipe+ 4.24% iov_iter_get_pages+ 3.92% __mutex_lock.constprop.01.81% iov_iter_advance+ 0.55% import_iovec+ 0.76% syscall_exit_to_user_mode1.54% syscall_return_via_sysret1.49% __entry_text_start
现在大量时间花费在等待管道可写(wait_for_space),以及唤醒等待管道填充内容的读程序(__wake_up_common_lock)。
为了避免这些同步成本,如果管道无法写入,我们可以让 vmsplice 返回,并执行忙循环直到写入为止——在用 splice 读取时做同样的处理:
...// SPLICE_F_NONBLOCK will cause `vmsplice` to return immediately// if we can't write to the pipe, returning EAGAINssize_t ret = vmsplice(STDOUT_FILENO, &bufvec, 1, SPLICE_F_NONBLOCK);if (ret < 0 && errno == EAGAIN) {continue; // busy loop if not ready to write}...
通过忙循环,我们的性能又提高了25%:
./write --write_with_vmsplice --huge_page --busy_loop | ./read --read_with_splice --busy_loop62.5GiB/s, 256KiB buffer, 40960 iterations (10GiB piped)

总结
通过查看 perf 输出和 Linux 源码,我们系统地提高了程序性能。在高性能编程方面,管道和拼接并不是真正的热门话题,而我们这里所涉及的主题是:零拷贝操作、环形缓冲区、分页与虚拟内存、同步开销。
尽管我省略了一些细节和有趣的话题,但这篇博文还是已经失控而变得太长了:
-
在实际代码中,缓冲区是分开分配的,通过将它们放置在不同的页表条目中来减少页表争用(FizzBuzz程序也是这样做的)。
-
记住,当使用 get_user_pages 获取页表条目时,其 refcount 增加,而 put_page 减少。如果我们为两个缓冲区使用两个页表条目,而不是为两个缓冲器共用一个页表条目的话,那么在修改 refcount 时争用更少。
-
通过用taskset将./write和./read进程绑定到两个核来运行测试。
-
资料库中的代码包含了我试过的许多其他选项,但由于这些选项无关紧要或不够有趣,所以最终没有讨论。
-
资料库中还包含get_user_pages_fast 的一个综合基准测试,可用来精确测量在用或不用大页的情况下运行的速度慢多少。
-
一般来说,拼接是一个有点可疑/危险的概念,它继续困扰着内核开发人员。
请让我知道本文是否有用、有趣或不一定!

致谢
非常感谢 Alexandru Scvorţov、Max Staudt、Alex Appetiti、Alex Sayers、Stephen Lavelle、Peter Cawley和Niklas Hambüchen审阅了本文的草稿。Max Staudt 还帮助我理解了 get_user_page 的一些微妙之处。
1. 这将在风格上类似于我的atan2f性能调研(https://mazzo.li/posts/vectorized-atan2.html),尽管所讨论的程序仅用于学习。此外,我们将在不同级别上优化代码。调优 atan2f 是在汇编语言输出指导下进行的微优化,调优管道程序则涉及查看 perf 事件,并减少各种内核开销。
2. 本测试在英特尔 Skylake i7-8550U CPU 和 Linux 5.17 上运行。你的环境可能会有所不同,因为在过去几年中,影响本文所述程序的 Linux 内部结构一直在不断变化,并且在未来版本中可能还会调整。
3. “FizzBuzz”据称是一个常见的编码面试问题,虽然我个人从来没有被问到过该问题,但我有确实发生过的可靠证据。
4. 尽管我们固定了缓冲区大小,但即便我们使用不同的缓冲区大小,考虑到其他瓶颈的影响,(吞吐量)数字实际也并不会有很大差异。
5. 关于有趣的细节,可随时参考资料库。一般来说,我不会在这里逐字复制代码,因为细节并不重要。相反,我将贴出更新的代码片段。
6. 注意,这里我们分析了一个包括管道读取和写入的shell调用——默认情况下,perf record跟踪所有子进程。
7. 分析该程序时,我注意到 perf 的输出被来自“Pressure Stall Information”基础架构(PSI)的信息所污染。因此这些数字取自一个禁用PSI后编译的内核。这可以通过在内核构建配置中设置 CONFIG_PSI=n 来实现。在NixOS 中:
boot.kernelPatches = [{name = "disable-psi";patch = null;extraConfig = ''PSI n'';}];
此外,为了让 perf 能正确显示在系统调用中花费的时间,必须有内核调试符号。如何安装符号因发行版而异。在最新的 NixOS 版本中,默认情况下会安装它们。
8. 假如你运行了 perf record -g,可以在 perf report 中用 + 展开调用图。
9. 被称为 tmp_page 的单一“备用页”实际上由 pipe_read 保留,并由pipe_write 重用。然而由于这里始终只是一个页面,我无法利用它来实现更高的性能,因为在调用 pipe_write 和 pipe_ read 时,页面重用会被固定开销所抵消。
10. 从技术上讲,vmsplice 还支持在另一个方向上传输数据,尽管用处不大。如手册页所述:
vmsplice实际上只支持从用户内存到管道的真正拼接。反方向上,它实际上只是将数据复制到用户空间。
11. Travis Downs 指出,该方案可能仍然不安全,因为页面可能会被进一步拼接,从而延长其生命期。这个问题也出现在最初的 FizzBuzz 帖子中。事实上,我并不完全清楚不带 SPLICE_F_GIFT 的 vmsplice 是否真的不安全——vmsplic 的手册页说明它是安全的。然而,在这种情况下,绝对需要特别小心,以实现零拷贝管道,同时保持安全。在测试程序中,读取端将管道拼接到/dev/null 中,因此可能内核知道可以在不复制的情况下拼接页面,但我尚未验证这是否是实际发生的情况。
12. 这里我们呈现了一个简化模型,其中物理内存是一个简单的平面线性序列。现实情况复杂一些,但简单模型已能说明问题。
13. 可以通过读取 /proc/self/pagemap 来检查分配给当前进程的虚拟页面所对应的物理地址,并将“页面帧号”乘以页面大小。
14. 从 Ice Lake 开始,英特尔将页表扩展为5级,从而将最大可寻址内存从256TiB 增加到 128PiB。但此功能必须显式开启,因为有些程序依赖于指针的高 16 位不被使用。
15. 页表中的地址必须是物理地址,否则我们会陷入死循环。
16. 注意,高 16 位未使用:这意味着我们每个进程最多可以处理 248 − 1 字节,或 256TiB 的物理内存。
17. struct page 可能指向尚未分配的物理页,这些物理页还没有物理地址和其他与页相关的抽象。它们被视为对物理页面的完全抽象的引用,但不一定是对已分配的物理页面的引用。这一微妙观点将在后面的旁注中予以说明。
18. 实际上,管道代码总是在 nr_pages = 16 的情况下调用 get_user_pages_fast,必要时进行循环,这可能是为了使用一个小的静态缓冲区。但这是一个实现细节,拼接页面的总数仍将是32。
19. 以下部分是本文不需要理解的微妙之处!
如果页表不包含我们要查找的条目,get_user_pages_fast 仍然需要返回一个 struct page。最明显的方法是创建正确的页表条目,然后返回相应的 struct page。
然而,get_user_pages_fast 仅在被要求获取 struct page 以写入其中时才会这样做。否则它不会更新页表,而是返回一个 struct page,给我们一个尚未分配的物理页的引用。这正是 vmsplice 的情况,因为我们只需要生成一个 struct page 来填充管道,而不需要实际写入任何内存。
换句话说,页面分配会被延迟,直到我们实际需要时。这节省了分配物理页的时间,但如果页面从未通过其他方式填充错误,则会导致重复调用 get_user_pages_fast 的慢路径。
因此,如果我们之前不进行 memset,就不会“手动”将错误页放入页表中,结果是不仅在第一次调用 get_user_pages_fast 时会陷入慢路径,而且所有后续调用都会出现慢路径,从而导致明显地减速(25GiB/s而不是30GiB/s):
./write --write_with_vmsplice --dont_touch_pages | ./read --read_with_splice25.0GiB/s, 256KiB buffer, 40960 iterations (10GiB piped)
此外,在使用大页时,这种行为不会表现出来:在这种情况下,get_user_pages_fast 在传入一系列虚拟内存时,大页支持将正确地填充错误页。
如果这一切都很混乱,不要担心,get_user_page 和 friends 似乎是内核中非常棘手的一角,即使对于内核开发人员也是如此。
20. 仅当 CPU 具有 PDPE1GB 标志时。
21. 例如,CPU包含专用硬件来缓存部分页表,即“转换后备缓冲区”(translation lookaside buffer,TLB)。TLB 在每次上下文切换(每次更改 CR3 的内容)时被刷新。大页可以显著减少 TLB 未命中,因为 2MiB 页的单个条目覆盖的内存是 4KiB 页面的 512 倍。
22. If you're thinking "too bad!" various efforts are being made to simplify and/or optimize this situation. Recent kernels (since 5.17) include a new type , struct folio, for explicitly identifying header pages. This reduces the need to check whether a struct page is the first or last page at runtime, thereby improving performance. Other efforts aim to completely remove the extra struct pages, although I don't know how.