(Click on the top to quickly follow and set as a star to learn Python together)
Source丨Data STUDIO
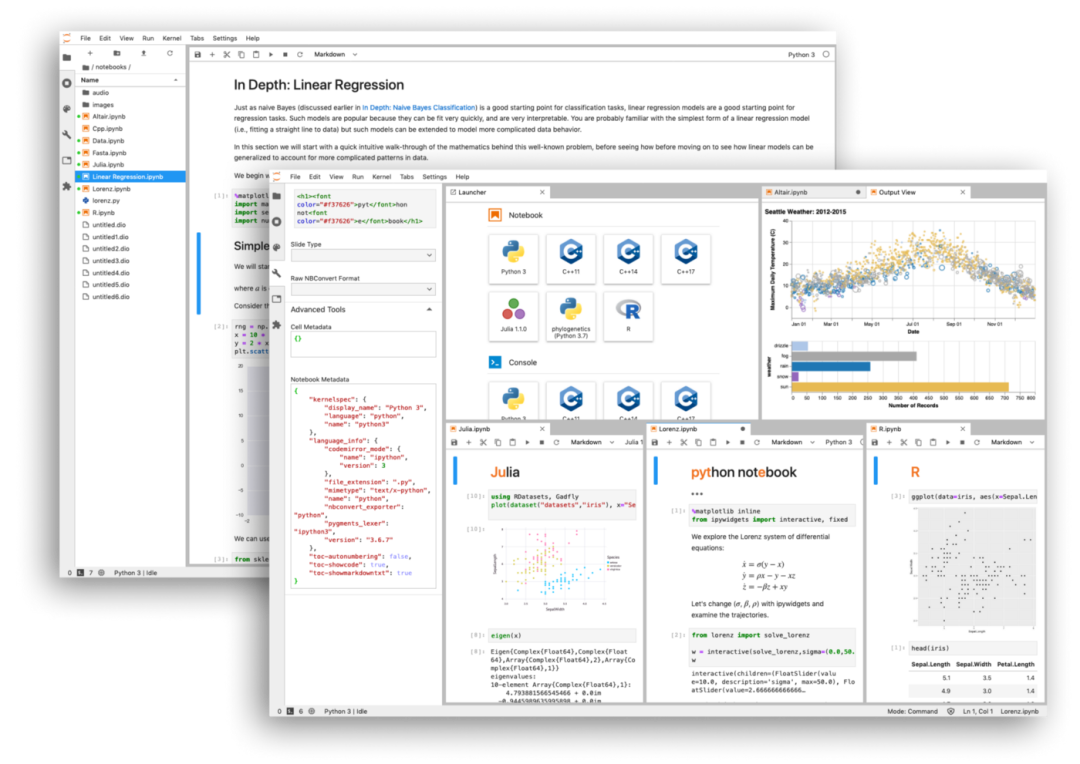
How to choose a Python code editor? PyCharm, VS Code, and Jupyter Notebook all have their own characteristics. Jupyter is suitable for data analysis operations that require visualization, and PyCharm is more suitable for complete Python projects.
However, because of the interactive operation, few developers think of using Jupyter for debugging.
Although many readers may think that Jupyter is enough for demonstrations and small experiments, Debug does not have much demand, but making up for the missing link of Jupyter can make it more usable, and Debug will also be used as the default mode in the future.
Why does Jupyter need Debug?
Although Jupyter has good interactive performance, it also understands that for large code bases, it is better to use traditional IDEs.
So in order to make up for this shortcoming, the Jupyter project has also hoped to enhance the processing of large code bases through JupyterLab in the past few years.
However, JupyterLab still has a big flaw, it cannot debug in a visual way, which limits further debugging. These days, the Jupyter team said that after several months of development, they are excited to release the Jupyter Visual Debugger for the first time.
Although this is only the first version, it is now possible to set common breakpoints to debug and view various variables, execution modules and other information.
The usage of the new tool is also very simple, and the common Debug method is similar. If the reader wants to install this new tool, then first you need to install the front-end plugin for JupyterLab:
jupyter labextension install @jupyterlab/debugger
As for the back-end Kernel, the Jupyter team said that the current kernel needs to implement the Jupyter Debug Protocol, so for the time being, only xeus-python can be used:
conda install xeus-python -c conda-forge
As long as the front-end and back-end are installed, we can use it directly. The developer also provides an online experience version of Debug, which can be experienced without installing anything.
Online Debug environment:
https://hub.gke.mybinder.org/user/jupyterlab-debugger-hwxovlw4/lab/tree/examples/index.ipynb
Xeus-python
The first kernel to support Jupyter Debug
Xeus is a C++ implementation of the Jupyter kernel protocol, which is not a kernel itself, but a library that helps build the kernel. It is useful when developers want to build language kernels such as Python, Lua, etc. that have C, C++ APIs.
At present, some kernels have been developed using xeus. The Xeus-python kernel is an optional kernel when we do Python development. It was released last year. The reason why Xeus-python was selected by the Jupyter team as the first kernel to implement Debug is that it has the following two advantages:
-
Xeus-python has a pluggable concurrency model that allows the processing of Control channels to run in different threads; -
Xeus-python has a very lightweight codebase, so iteration and updates are very convenient.
In the short term, xeus-python will have plans for further improvement, such as adding Ipython magic methods, optimizing xeus-python's PyPI, etc.
Dive into the front-end architecture of the debugger
JupyterLab's debugger extension provides common functions for users' IDE usage habits:
-
Sidebar with explorer, unordered list, source preview and allows navigation to call stacks -
Ability to set breakpoints directly next to the code (i.e. in code cells as well as in the code console) -
A visual marker indicating where the current execution stops
When using Jupyter notebooks, the state of execution is kept in the kernel. But if we execute a cell and then delete the entire cell, what if the user wants to run the code when Dubug?
As shown in the animation below, the plugin supports specific use cases and can view previously executed cells in read-only mode.
Debugging can be enabled at the notebook level, allowing users to debug a notebook while working on another notebook.
Variables can be inspected using tree and table viewers:
JupyterLab's debugger plugin is targeted for use with any debug-capable kernel. Through the Debug Adapter Protocol, debugger plugins can abstract language-specific functions and provide users with a matching debugging interface.
And the team plans to make major improvements to the debugger experience in 2020, such as support for rich rendering in the variable browser and support for conditional breakpoints in the UI.
VS Code Visual Debug Tool
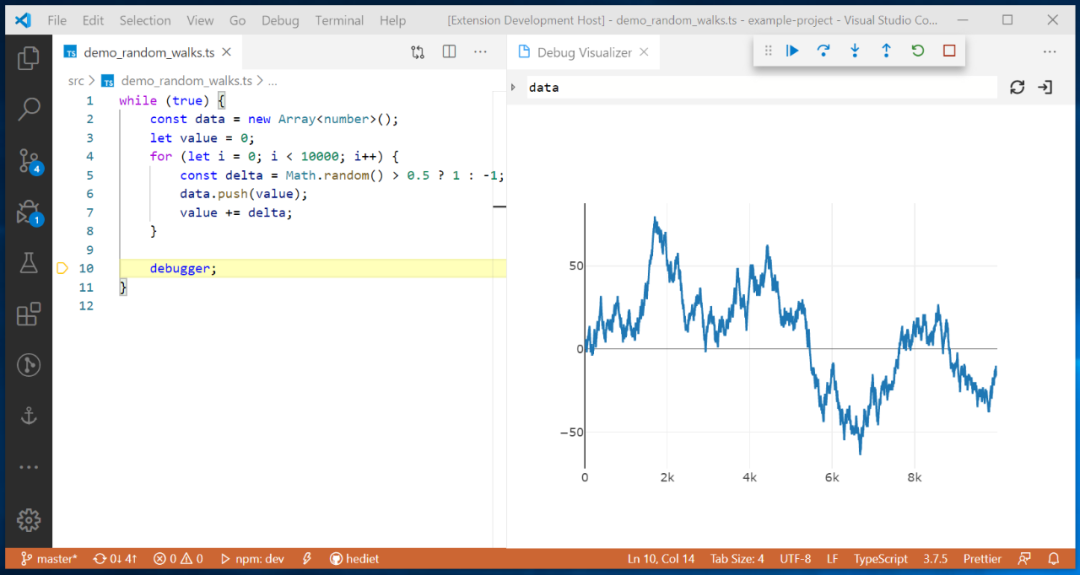
Debug is a long road. Not long ago, I introduced a VS Code real-time visual debugging tool, which can also be used as a reference here. Helping users find code problems in a more elegant and concise way of debugging is one of the directions for future optimization, and the visual debugging introduced earlier can quickly display data structures.
From the effect level, this tool is even more amazing, and it is completely different from the traditional debug method in the past. For example, setting the breakpoint to line 32 to define a doubly linked list, and then running the code line by line will show the corresponding line in the right picture. Data structure diagram.
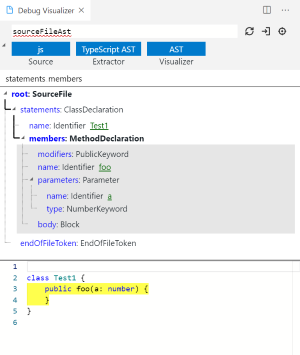
At the same time, it will be displayed in different ways according to the data structure, such as tree, table, curve and graph.
At the same time, it also has built-in other customizable visualization adjusters, which can choose a more understandable visualization method according to different processing objects. Such as chart visualization, Plotly visualization, Tree visualization, grid visualization, text visualization, etc.
However, the developers of this VS Code debug tool are discussing its support for Python, and perfect support for Python will make the project more convenient and applicable.
For debug, whether it is the print() method, or the assert statement, or directly setting breakpoints, including various new debug tools. From the perspective of auxiliary tools, as long as it can improve work efficiency, no matter which debug tool it is, it is worth a try to find the one that suits you.
Reference link:
https://blog.jupyter.org/a-visual-debugger-for-jupyter-914e61716559
https://www.reddit.com/r/MachineLearning/comments/foum00/n_jupyter_visual_debugger/
Recommended reading:
Getting Started: The most complete zero-based learning Python problem | Zero-based learning Python for 8 months | Practical projects | Learning Python is this shortcut
Dry goods: Crawling Douban short comment, the movie "Later Us" | 38 years of NBA's best player analysis | From much anticipation to word of mouth! Tang Detective 3 is disappointing | Laughing at the new Yitian and Dragon Slayer | Lantern riddle answering king | Use Python to make a large number of sketches of young ladies | Mission Impossible is so popular, I use machine learning to make a mini recommendation system movie
Fun: Pinball game | Jiugongge | Beautiful flower | Two hundred lines of Python "Running every day" game!
AI: A robot that can write poetry | Color pictures | Predict income | Mission Impossible is so popular, I use machine learning to make a mini recommendation system movie
Widget: Convert Pdf to Word, easily get tables and watermarks! | Save html web pages as pdf with one click! | Goodbye PDF extraction charges! | Create the strongest PDF converter with 90 lines of code, one-click conversion of word, PPT, excel, markdown, html | Make a DingTalk low-cost ticket reminder! |60 lines of code make a voice wallpaper switcher, watch Miss Sister every day! |
The year's hottest copy
Click to read the original text and watch my video at station B!
