Prepare data and associated libraries
Mainly use Pandas library and Seaborn library.
import pandas as pd
import numpy as np
import seaborn as sns
%matplotlib inline
Generate 4 sets of data and convert to DataFramedata type
xarray = np.linspace(0,10,100)#生成从0倒10,100个数
yarray = xarray**3+np.random.normal(0,100,100) # y=x^3+正态扰动项
zarray = -100*xarray+np.random.normal(0,10,100) # y=-100x+正态扰动项
warray = 200*xarray**0.5+np.random.normal(0,10,100)
| x | y | z | w | |
|---|---|---|---|---|
| 0 | 0 | 66.5297 | -7.81256 | 14.5319 |
| 1 | 0.10101 | -34.835 | -18.8105 | 65.9947 |
| 2 | 0.20202 | 37.5717 | -21.8944 | 96.7367 |
| 3 | 0.30303 | 140.38 | -28.7846 | 101.061 |
| 4 | 0.40404 | 202.198 | -47.9113 | 127.187 |
Univariate Analysis
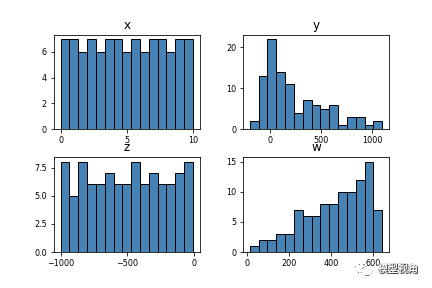
Frequency distribution histogram
df.hist(bins=15, color='steelblue', edgecolor='black', linewidth=1.0,
           xlabelsize=8, ylabelsize=8, grid=False)
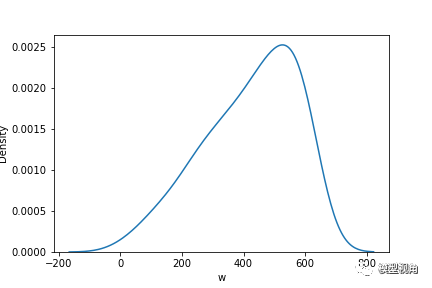
Probability Density Curve
sns.kdeplot(df['w'])
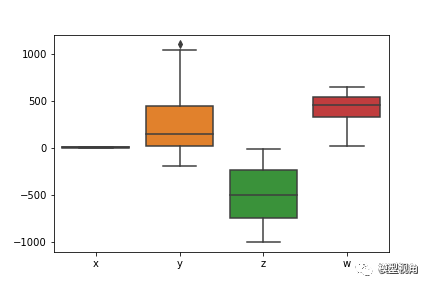
boxplot
sns.boxplot(data=df)
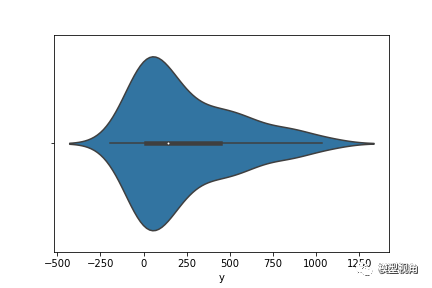
Violin figure
Another efficient way to display grouped numerical data using a kernel density plot (depicts the probability density of the data at different values)
sns.violinplot(data=df)
multivariate analysis
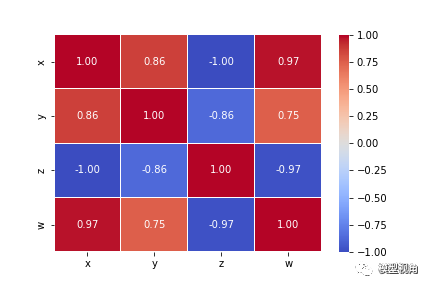
Correlation heatmap
sns.heatmap(round(df.corr(),2), annot=True, cmap="coolwarm",fmt='.2f',
                 linewidths=.05)
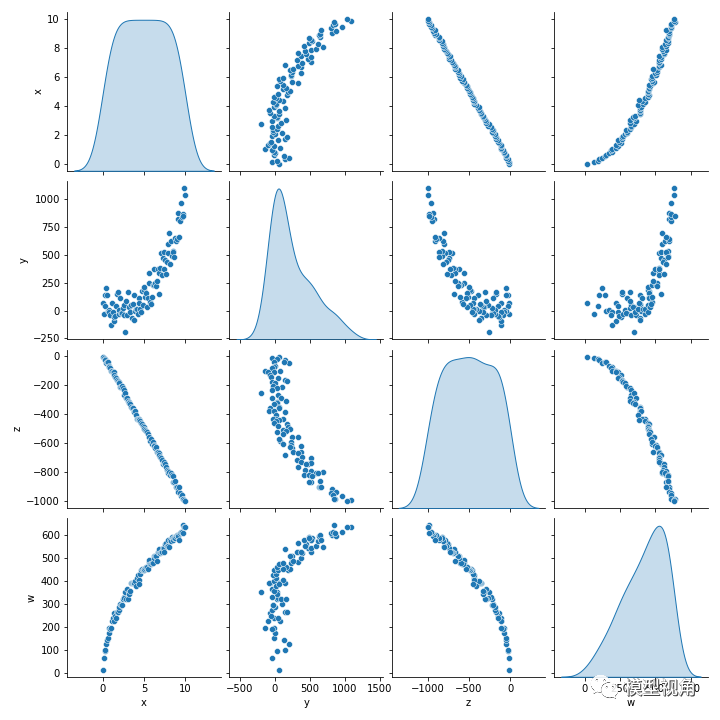
Paired Scatter Plot
sns.pairplot(data=df,diag_kind='kde')
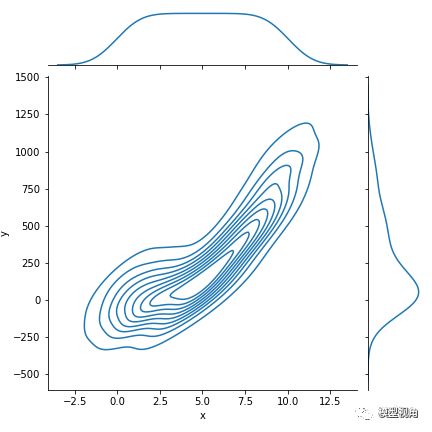
joint probability distribution
sns.jointplot(x='x',y='y',data=df,kind='kde')
