In the previous issue, we discussed the meaning and basic method of EIRP measurement in radio management. In this issue, we further discuss the measurement method of EIRP through an actual measurement case of a UAV countermeasure system.
As the popularity of drones becomes uncontrollable, the drone countermeasure system also emerges as the times require. The UAV countermeasure system refers to a device that detects, identifies, interferes, deceives, controls or even destroys UAVs. It is usually installed in some important places, such as oil depots, gas stations, etc. machine security threats. However, when the UAV countermeasure system is turned on, it will also interfere with the navigation equipment of legal aircraft, such as the civil aviation GPS navigation system, thus bringing hidden dangers to the safe flight of civil aviation.
As a radio manager, it is necessary to precisely manage the UAV countermeasure system and limit its scope of action so that it will not cause unnecessary interference to other communication systems while ensuring its own safety. Since the UAV countermeasure system is aimed at air targets, its radio wave propagation path is free space, so its EIRP can be used as an important basis for judging the coverage.
Measurement method of UAV countermeasure system EIRP
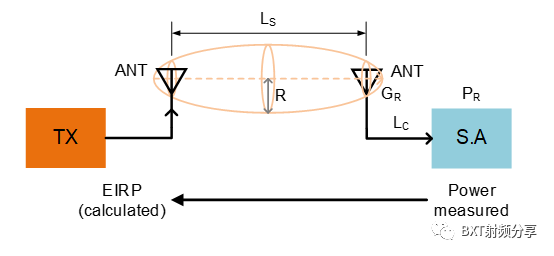
In the previous issue, the general measurement method of EIRP was discussed (Figure 37-1), and the UAV countermeasure was calculated by combining the reading of the spectrum analyzer with the gain of the test antenna, the cable loss, and the path loss between the transmitting and receiving antennas. EIRP of the system.
When calculated logarithmically, it can be expressed as:
EIRP = P R – G R + L C + L S (37-1)
The unit of EIRP is dBm, where P R is the reading of the spectrum analyzer (dBm), GR is the test antenna gain (dBi), LC is the feeder loss (dB), and L S is the path loss (dB) between the transmit and receive antennas.
In the EIRP measurement, the gain, cable loss and spectrum analyzer of the test antenna can be accurately calibrated. The path loss between the transceiver antennas is calculated using the free-space propagation model. To ensure the accuracy of the path loss, first ensure that the transceiver antenna path There are no obstacles in the first Fresnel zone (in the R zone in Figure 37-1).
Referring to the test principle in Figure 37-1, we designed the EIRP test plan for the UAV countermeasure system (Figure 37-2).
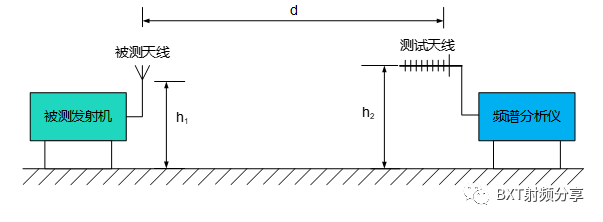
Where h 1 and h 2 are the heights of the antenna under test and the test antenna from the installation ground, respectively, and d is the distance between the transceiver antennas. The basic design principles include the following two points:
-
Ensure that there are no obstacles in the Fresnel zone, which is beneficial to the accuracy of space loss;
-
The test antenna selects different heights h2 to find the main lobe of the antenna radiation of the device under test, and the measured maximum value is the EIRP value of the device under test.
Using the test method shown in Figure 37-2, we tested different operating frequencies of a UAV countermeasure device, and obtained the following test results using Equation 37-1:
Table 37-1: EIRP test values

After the EIRP test is completed, we move the test equipment to the edge of the coverage of the device under test. The condition for defining the edge of coverage is the position where the GPS receiver is just interfered. In this case, the measured level value can be used as the unmanned The basis for determining the edge coverage of the machine countermeasure equipment.
Table 37-2: Coverage Edge Levels for UAV Countermeasures

Extended testing – testing the sensitivity of the system
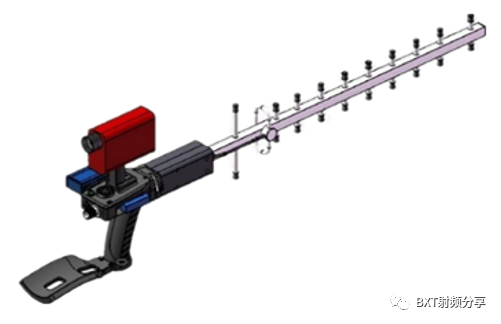
As an extension test, we used a high-sensitivity monitoring front-end with a spectrum analyzer to test the signal (1575MHz) of a UAV countermeasure system. This test front-end has an antenna gain of 12dBi and an active gain of 30dB (Figure 37). -3).

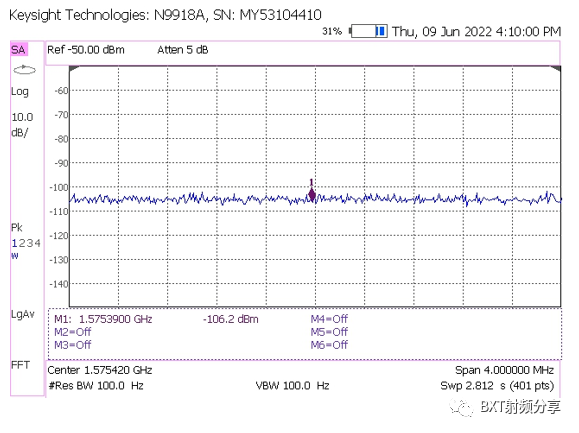
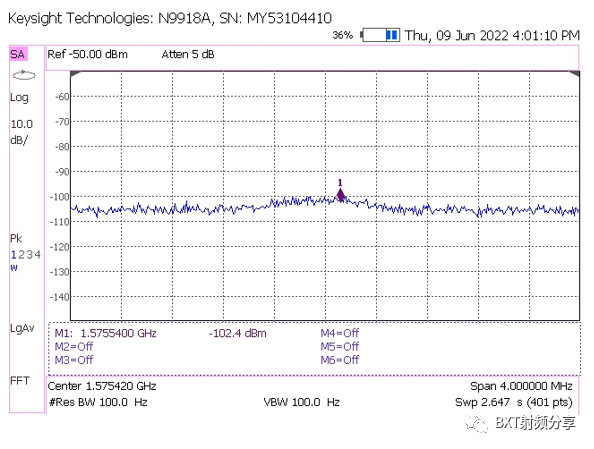
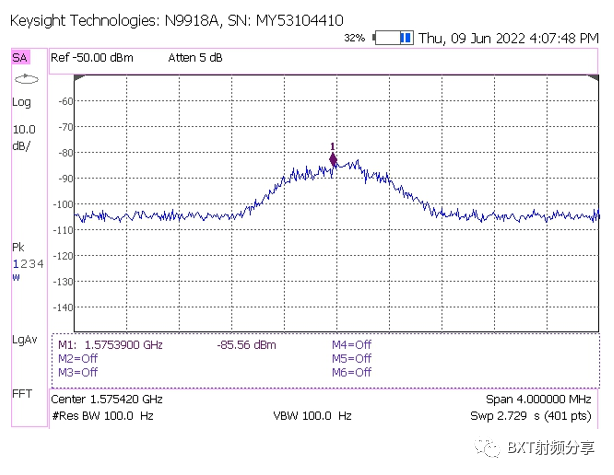
The test results show that the signal outside the line of sight (point A) is blocked (Figure 37-4b). When the test antenna is moved to the edge of the building (point B), a weak signal can be found. At this time, it can be clear after connecting the amplifier. Find the signal under test.
In the opening test of microwave signal, besides the monitoring system should have high enough sensitivity, the selection of test point is very important. In the test scenario shown in Figure 37-4a, the distance between the transmitting and receiving antennas is less than 100 meters, but due to the occlusion of buildings, signals cannot be received from many angles.
For the series of products involved in this article, for detailed product information and test methods, please call 0591-83789500 or send an email to [email protected] for consultation.
BXT technologies, Fuzhou Boxuntong Electronics Co., Ltd. was established in 1998, focusing on the development and production of RF test and measurement systems. Our products include RF measurement subsystems, RF/microwave devices and custom test systems. These products have been widely used in radio monitoring stations, aerospace and military industries, radio equipment manufacturers, radio measurement and research institutions, overseas markets, etc.