Introduction: Prometheus is an open source complete monitoring solution. This article will give you a basic understanding of Prometheus from index capture to query and visual display, as well as the final monitoring alarm.
1. Introduction
Prometheus is a god of the Titans in ancient Greek mythology. The name means "foresight". The picture below shows Prometheus being punished by Zeus and suffering from eclipse of the liver.
 The following is what we CRUD Boy know about Prometheus, and the following is the introduction to the cover image of its official website:
 From metrics to insight, From indicators to insight, gain insight into your system through indicators, and provide an open source solution for indicator collection and monitoring for our system.
In other words, Prometheus is a data monitoring solution that allows us to keep abreast of the running status of the system, quickly locate problems and troubleshoot.
 Prometheus is developing very fast. It was developed in 2012, and joined CNCF in 2016. It became the second CNCF-hosted project after K8s. At present, it has 42k on Github, and the community is very active and the maintenance frequency is very high. It is basically stable for 1 month. Iteration speed of 1 small version.

2. Overall ecology
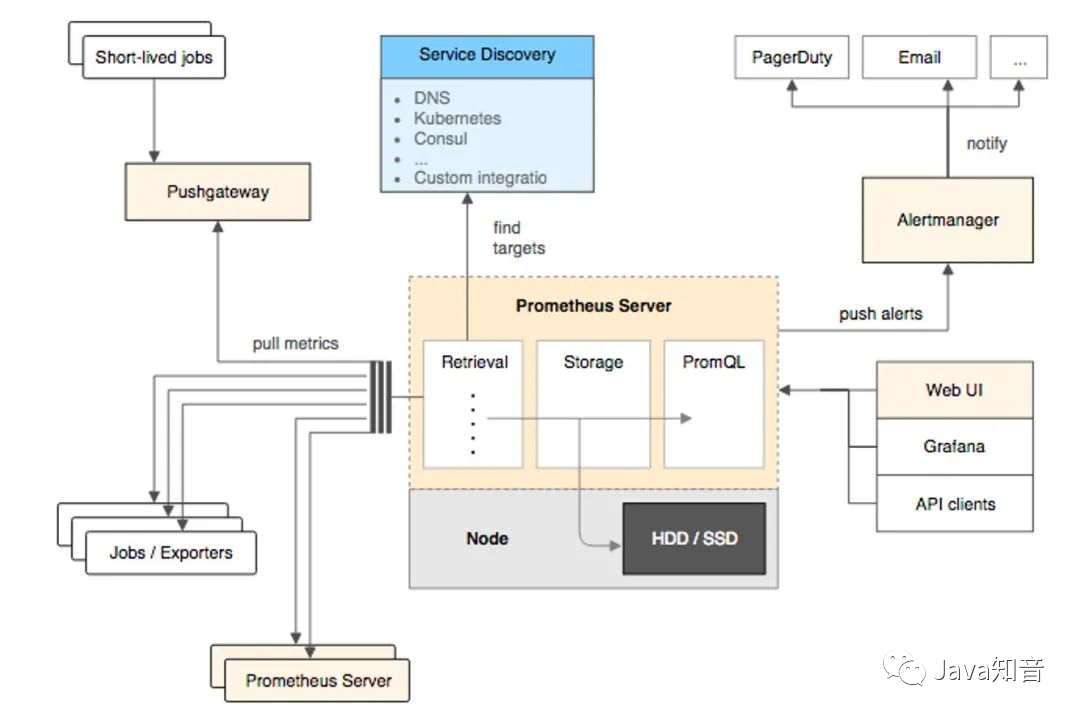
Prometheus provides a series of components from indicator exposure, to indicator capture, storage and visualization, and finally monitoring and alerting.
(1) Indicator exposure
Each service monitored by Prometheus is a Job. Prometheus provides official SDK for these jobs. Using this SDK, you can customize and export your own business indicators, and you can also use various common components and middleware officially provided by Prometheus. Exporter (such as commonly used MySQL, Consul, etc.).
For script tasks executed in a short time or services that cannot directly pull indicators, Prometheus provides a PushGateWay gateway for these tasks to actively push service indicators to the gateway, and Prometheus then pulls indicators from this gateway.
(2) Index capture
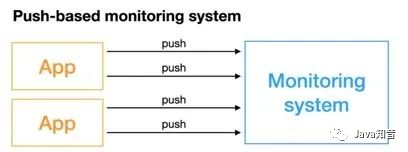
Push and Pull are mentioned above, but in fact, these are two index capture models.
-
Pull model: The monitoring service actively pulls the metrics of the monitored service.
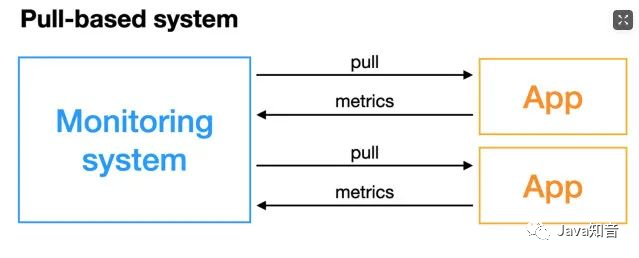
The monitored service generally exposes the indicators by actively exposing the metricsport or through Exporterthe method. The monitoring service relies on the service discovery module to discover the monitored service, so as to periodically capture the indicators.
-
Push model: The monitored service actively pushes the indicators to the monitoring service, which may require protocol adaptation of the indicators, and must conform to the indicator format required by the monitoring service.
 For
For Prometheusthe index capture in the middle, the Pull model is used. The default is to pull the index once a minute. Through the configuration item configuration Prometheus.yamlin the configuration file, the Pull model is used externally, one is the exposed index, and the other is the exposed index . index of.scrape_intervalPrometheusPull ExporterPull PushGateway
(3) Index storage and query
After the index is captured, it will be stored in the built-in time series database, Prometheusand the PromQL query language is also provided for us to query the index. We can query our index visually Prometheusthrough the WebUI PromQL, and can also easily access third-party data. Visualization tools, eg grafana.
(4) Monitoring and alarming
prometheusProvides alertmanageersystem monitoring alarms based on promql. When the indicators queried by promql exceed the thresholds we defined, prometheusan alarm message will be sent to alertmanager, and the manager will send the alarms to the configured mailbox or WeChat.
3. Working principle
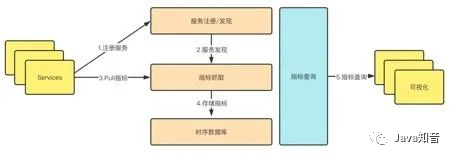
PrometheusThe process from the registration of the monitored service to the index capture to the index query is divided into five steps:
(1) Service registration
The monitored service Prometheusis a Job in , and all instances Prometheusof are a target in , so the registration of the monitored service is Prometheusto register a Job and all its targets in . This registration is divided into: static registration and Dynamic registration .
Static registration: Statically configure the IP of the service and the port number of the captured metrics under the configuration of the Prometheus yamlfile scrape_configs:
scrape_configs:
 - job_name: "prometheus"
   static_configs:
   - targets: ["localhost:9090"]
The above is to register a service named prometheus, there is an instance under this service, and the exposed crawl address is localhost:9090.
Dynamic registration: Dynamic registration is to configure the address and service name of the service discovery under the configuration of the Prometheus yamlfile. It will go to the address and dynamically discover the instance list according to the service name you provide. It supports consul, DNS, file, K8s, etc. Service discovery mechanism. Consul-based service discovery:scrape_configsPrometheusPrometheus
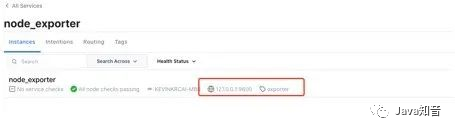
- job_name: "node_export_consul"
    metrics_path: /node_metrics
    scheme: http
    consul_sd_configs:
      - server: localhost:8500
        services:
          - node_exporter
The address of our consul is: localhost:8500, the service name is , there is an instance node_exporterunder this service : .exporterlocalhost:9600
 Note: If it is dynamic registration, it is best to add these two configurations. The path of static registration index pull will be specified for us by default
 metrics_path:/metrics, so if the exposed index capture path is different or dynamic service registration, it is best to add these two configurations.
Otherwise, an error will be reported “INVALID“ is not a valid start token. Under the demonstration, Baidu took a look. This may be caused by the inconsistent data format.
metrics_path: /node_metrics
scheme: http
Finally, the discovered instances can be viewed in the webUI:
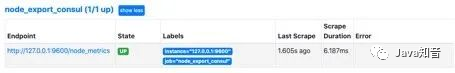 Currently,
 Prometheusup to two dozen service discovery protocols are supported:
<azure_sd_config>
<consul_sd_config>
<digitalocean_sd_config>
<docker_sd_config>
<dockerswarm_sd_config>
<dns_sd_config>
<ec2_sd_config>
<openstack_sd_config>
<file_sd_config>
<gce_sd_config>
<hetzner_sd_config>
<http_sd_config>
<kubernetes_sd_config>
<kuma_sd_config>
<lightsail_sd_config>
<linode_sd_config>
<marathon_sd_config>
<nerve_sd_config>
<serverset_sd_config>
<triton_sd_config>
<eureka_sd_config>
<scaleway_sd_config>
<static_config>
(2) Configuration update
After updating Prometheusthe configuration file, we need to update our configuration to the program memory. There are two ways to update here. The first is simple and rude, that is, restarting Prometheus, and the second is dynamic update. How to dynamically update the Prometheus configuration.
Step 1: First, make sure Prometheusto bring the startup parameters when starting up:--web.enable-lifecycle
prometheus --config.file=/usr/local/etc/prometheus.yml --web.enable-lifecycle
Step 2: To update our Prometheusconfiguration:
curl -v --request POST 'http://localhost:9090/-/reload'
Step 3: After updating the configuration, we can dynamically update the configuration through Post request:
principle:
PrometheusIn the web module, a handler:
if o.EnableLifecycle {
   router.Post("/-/quit", h.quit)
   router.Put("/-/quit", h.quit)
   router.Post("/-/reload", h.reload)  // reload配置
   router.Put("/-/reload", h.reload)
}
This is achieved by h.reloadthis handlermethod: this handleris to channlesend a signal to one:
func (h *Handler) reload(w http.ResponseWriter, r *http.Request) {
   rc := make(chan error)
   h.reloadCh <- rc    // 发送一个信号到channe了中
   if err := <-rc; err != nil {
      http.Error(w, fmt.Sprintf("failed to reload config: %s", err), http.StatusInternalServerError)
   }
}
This will be monitored in the main function channel. As long as the signal is monitored, the configuration will be reloaded and the new configuration will be loaded into the memory again.
case rc := <-webHandler.Reload():
   if err := reloadConfig(cfg.configFile, cfg.enableExpandExternalLabels, cfg.tsdb.EnableExemplarStorage, logger, noStepSubqueryInterval, reloaders...); err != nil {
      level.Error(logger).Log("msg", "Error reloading config", "err", err)
      rc <- err
   } else {
      rc <- nil
   }
(3) Index capture and storage
PrometheusThe method of active pull is adopted for the capture of indicators, that metricsis, the interface or the interface exposed by the monitoring service is periodically requested PushGatewayto obtain Metricsindicators. The default time is to capture once every 15s. The configuration items are as follows:
global:
 scrape_interval: 15s
The captured indicators will be stored in the memory in the form of time series, and will be flushed to the disk regularly. The default is to flush back every two hours. And in order to prevent Prometheusdata from being restored when a crash or restart occurs, Prometheusa write-ahead log similar to binlog in MySQL is also provided. When the Prometheuscrash restarts, the write-ahead log will be read to restore data.
4. Metric indicators
(1) Data model
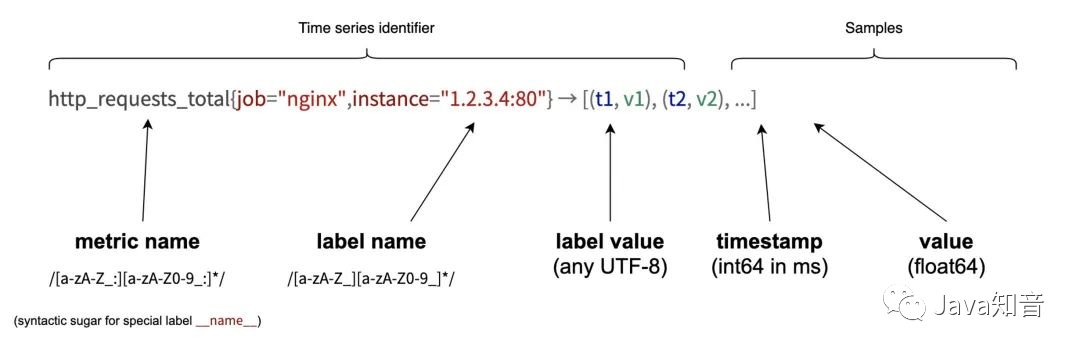
PrometheusAll collected indicators are stored in the form of time series, and each time series consists of three parts:
-
Indicator name and indicator label set:
metric_name{<label1=v1>,<label2=v2>....}, Indicator name: Indicates which aspect of the status of this indicator is monitored, such ashttp_request_total: the number of requests; indicator label, which describes the dimensions of this indicator, such ashttp_request_totalthis indicator, there is a request status codecode= 200/400/500, request method:method=get/postetc. , in fact, the indicator name is actually saved in the form of a label, this label is name, that is:name=. -
Timestamp: Describes the time of the current time series, in milliseconds.
-
Sample value: The specific value of the current monitoring indicator, for example
http_request_total, the value is the number of requests.
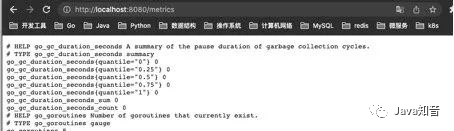
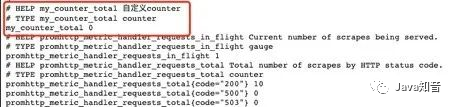
You can view all reported metrics through Prometheusthe viewing interface:metrics
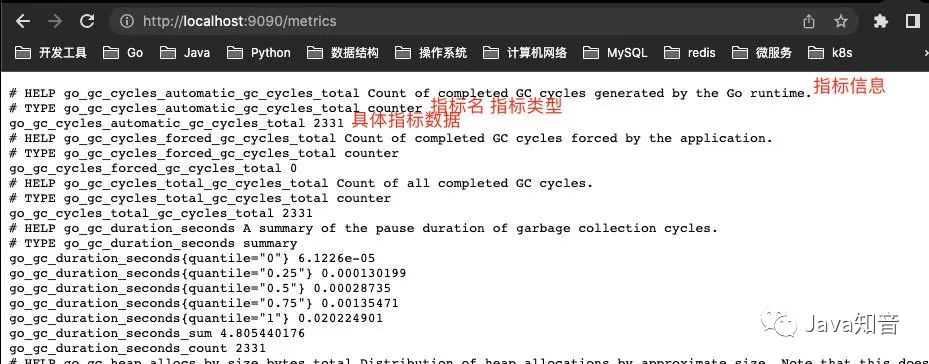 All indicators are also identified by the format shown below:
# HELP    // HELP:这里描述的指标的信息,表示这个是一个什么指标,统计什么的
# TYPE    // TYPE:这个指标是什么类型的
<metric name>{<label name>=<label value>, ...}  value    // 指标的具体格式,<指标名>{标签集合} 指标值
(2) Types of indicators
PrometheusIn fact, the underlying storage does not distinguish the types of indicators, and they are all stored in the form of time series. However, in order to facilitate the use of users and understand the differences between different monitoring indicators, Prometheusfour different indicator types are defined: counters counter, meters disk gauge, histogram histogram, abstract summary.
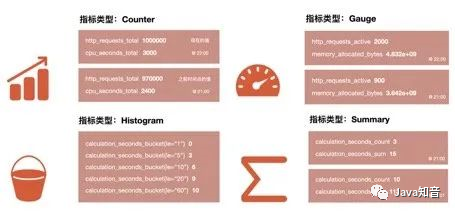
Counter counter:
CounterThe type is the same as the auto-increment command of redis, which only increases but does not decrease. Through the Counter indicator, monotonically increasing data such as the number of Http requests, the number of request errors, and the number of interface calls can be counted. At the same time, it can be combined with increasefunctions such as rate to count the rate of change. We will mention these built-in functions later.
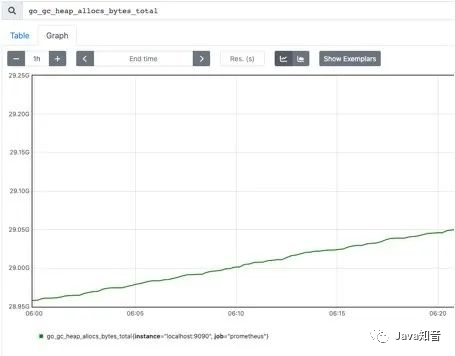
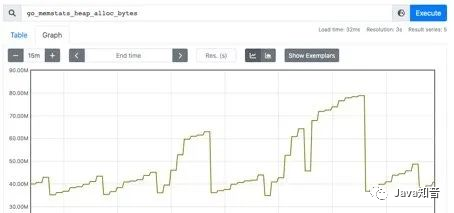
Gauge Dashboard:
Different from Counter, Gauge can be increased or decreased, which can reflect some dynamically changing data, such as current memory usage, CPU utilization, Gc times and other dynamic data that can be increased or decreased Prometheus. Reflecting the changes in data, the following figure shows the size of the space that can be allocated by the heap:
 The above two are numerical indicators, which represent the changes in the data,
 Histogramand the other Summaryare statistical indicators, which represent the distribution of the data.
Histogram histogram:
HistogramIt is a type of histogram, which can observe the distribution of indicators in different ranges, as shown in the following figure: You can observe the distribution of request time in each bucket.
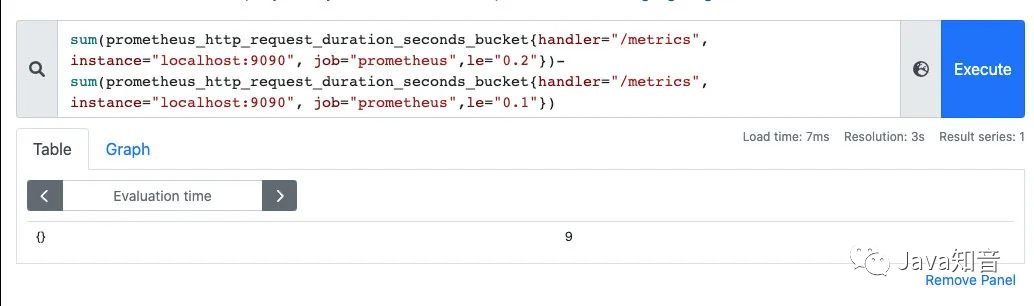
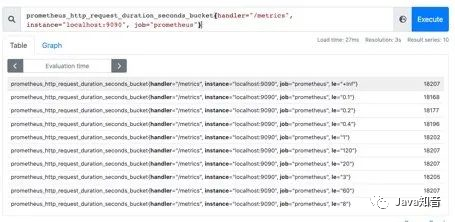 One thing to note is that it
 Histogramis a cumulative histogram, that is, each bucket has only the upper interval. For example, the following figure shows that the number of requests less than 0.1 milliseconds ( le=“0.1”) is 18173, and the number of requests less than 0.2 milliseconds ( le=“0.2”) is 181821, in le=“0.2”this The bucket contains the data of le=“0.1”this bucket. If we want to get the number of requests from 0.1 milliseconds to 0.2 milliseconds, we can subtract them from two buckets.
 In the histogram,
 histogram_quantilepercentiles can also be obtained through functions, such as P50, P90, P99 and other data.
Summary
SummaryIt is also used for statistical analysis, and the Histogramdifference is Summarythat the percentile is directly stored, as shown below: the median, P90 and P99 of the sample can be visually observed.
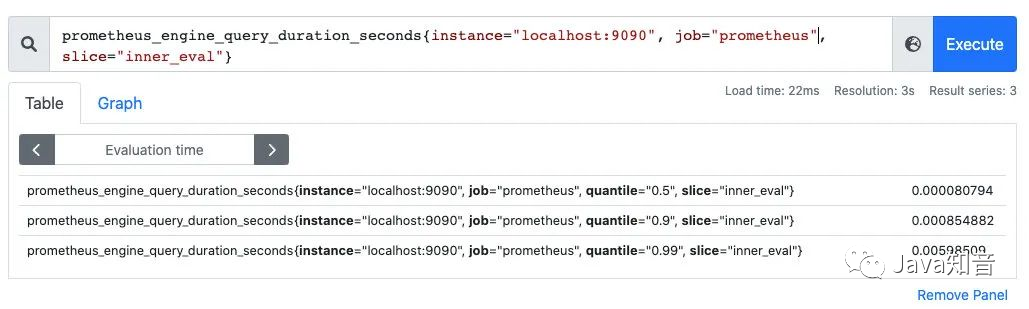
SummaryThe percentile of is calculated directly by the client Prometheus, and does not need to be Prometheuscalculated . The histogram is calculated by the built-in function histogram_quantileon the Prometheusserver .
(3) Index export
There are two ways to export indicators. One is to use Prometheusthe customized indicators provided by the community to export the indicators Exporterof some components such as MySQL and Kafka, or you can use the indicators provided by the community to Clientexport custom indicators.
github.com/prometheus/client_golang/prometheus/promhttp
Customize Prometheus exporter:
package main

import (
   "net/http"

   "github.com/prometheus/client_golang/prometheus/promhttp"
)

func main()  {
   http.Handle("/metrics", promhttp.Handler())
   http.ListenAndServe(":8080", nil)
}
Visit: http://localhost:8080/metrics, you can see the exported indicators, here we do not customize any indicators, but we can see some built-in Go runtime indicators and promhttp-related indicators, this Client defaults to our exposed indicators, go_: go_ for The prefixed metrics are about Go runtime-related metrics, such as garbage collection time, goroutinevolume, etc. These are specific to the Go client library, and client libraries in other languages may expose other runtime metrics for their respective languages. promhttp_: promhttpRelevant metrics from the toolkit to track processing of metrics requests.
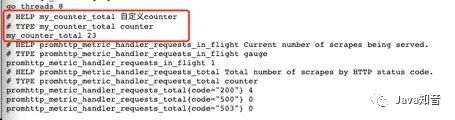
 Add custom metrics:
package main

import (
   "net/http"

   "github.com/prometheus/client_golang/prometheus"
   "github.com/prometheus/client_golang/prometheus/promhttp"
)

func main() {

   // 1.定义指标(类型,名字,帮助信息)
   myCounter := prometheus.NewCounter(prometheus.CounterOpts{
      Name: "my_counter_total",
      Help: "自定义counter",
   })
   // 2.注册指标
   prometheus.MustRegister(myCounter)
   // 3.设置指标值
   myCounter.Add(23)

   http.Handle("/metrics", promhttp.Handler())
   http.ListenAndServe(":8080", nil)
}
run:
 Report the amount of interface requests in the business under simulation:
package main

import (
   "fmt"
   "net/http"

   "github.com/prometheus/client_golang/prometheus"
)

var (
   MyCounter prometheus.Counter
)

// init 注册指标
func init() {
   // 1.定义指标(类型,名字,帮助信息)
   MyCounter = prometheus.NewCounter(prometheus.CounterOpts{
      Name: "my_counter_total",
      Help: "自定义counter",
   })
   // 2.注册指标
   prometheus.MustRegister(MyCounter)
}

// Sayhello
func Sayhello(w http.ResponseWriter, r *http.Request) {
   // 接口请求量递增
   MyCounter.Inc()
   fmt.Fprintf(w, "Hello Wrold!")
}
main.go:
package main

import (
   "net/http"

   "github.com/prometheus/client_golang/prometheus/promhttp"
)

func main() {

   http.Handle("/metrics", promhttp.Handler())
   http.HandleFunc("/counter",Sayhello)
   http.ListenAndServe(":8080", nil)
}
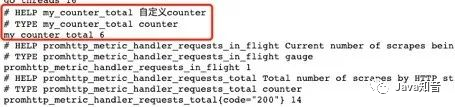
At first startup, the indicator counter is 0
 After calling:
 /counterthe interface, the indicator data has changed, so that the statistics of the number of interface requests can be simply realized:
 The way to define other indicators is the same:
var (
   MyCounter prometheus.Counter
   MyGauge prometheus.Gauge
   MyHistogram prometheus.Histogram
   MySummary prometheus.Summary
)

// init 注册指标
func init() {
   // 1.定义指标(类型,名字,帮助信息)
   MyCounter = prometheus.NewCounter(prometheus.CounterOpts{
      Name: "my_counter_total",
      Help: "自定义counter",
   })
   // 定义gauge类型指标
   MyGauge = prometheus.NewGauge(prometheus.GaugeOpts{
      Name: "my_gauge_num",
      Help: "自定义gauge",
   })
   // 定义histogram
   MyHistogram = prometheus.NewHistogram(prometheus.HistogramOpts{
      Name: "my_histogram_bucket",
      Help: "自定义histogram",
      Buckets: []float64{0.1,0.2,0.3,0.4,0.5},   // 需要指定桶
   })
   // 定义Summary
   MySummary = prometheus.NewSummary(prometheus.SummaryOpts{
      Name: "my_summary_bucket",
      Help: "自定义summary",
      // 这部分可以算好后在set
      Objectives: map[float64]float64{
         0.5: 0.05,
         0.9: 0.01,
         0.99: 0.001,
      },
   })

   // 2.注册指标
   prometheus.MustRegister(MyCounter)
   prometheus.MustRegister(MyGauge)
   prometheus.MustRegister(MyHistogram)
   prometheus.MustRegister(MySummary)
}
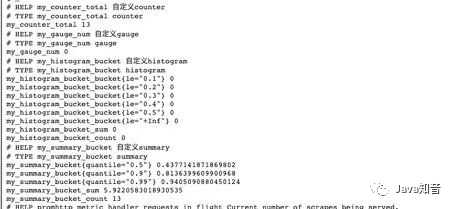 The above indicators are all without labels. Our general indicators are labeled. How to set the labels of indicators?
If I want to set a counter type indicator with a label, I just need to replace the original NewCountermethod with a NewCounterVecmethod and pass in the label collection.
MyCounter *prometheus.CounterVec
// 1.定义指标(类型,名字,帮助信息)
MyCounter = prometheus.NewCounterVec(
   prometheus.CounterOpts{
   Name: "my_counter_total",
   Help: "自定义counter",
   },
   // 标签集合
   []string{"label1","label2"},
)
// 带标签的set指标值
MyCounter.With(prometheus.Labels{"label1":"1","label2":"2"}).Inc()
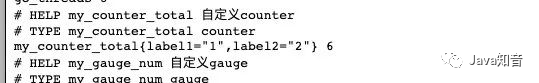 Others are the same.
5. PromQL
Just mentioned the types of indicators in Prometheus and how to export our indicators. Now that the indicators are exported to Prometheus, we can use the PromQL provided by it to query our exported indicators.
PromQL is a functional query language provided by Prometheus. There are four types of query expressions:
-
String: Appears only as an argument to some built-in functions; -
Scalar: A single numeric value, which can be a function parameter or the return result of a function; -
Instantaneous vector: time series data at a certain moment; -
Interval vector: A collection of time series data within a certain time interval.
(1) Instantaneous query
直接通过指标名即可进行查询,查询结果是当前指标最新的时间序列,比如查询Gc累积消耗的时间:
go_gc_duration_seconds_count
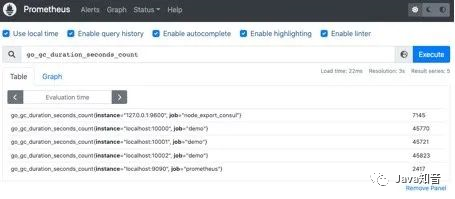 我们可以看到查询出来有多个同名指标结果 可以用
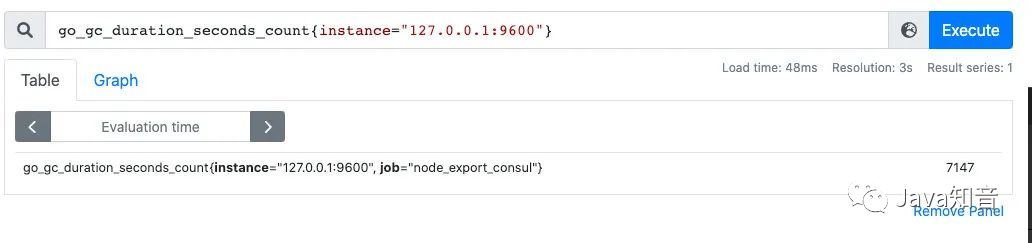
{}做标签过滤查询:比如我们想查指定实例的指标:
go_gc_duration_seconds_count{instance="127.0.0.1:9600"}
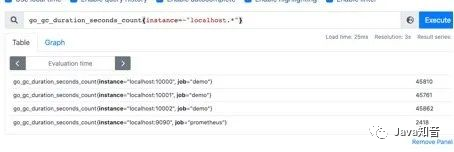
 而且也支持则表达式,通过
=~指定正则表达式,如下所示:查询所有instance是localhost开头的指标
go_gc_duration_seconds_count{instance=~"localhost.*"}
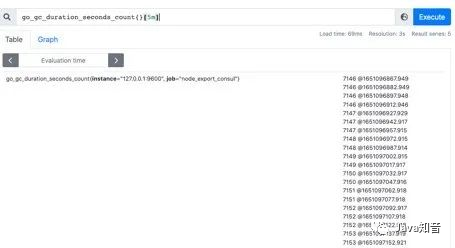
(二)范围查询
范围查询的结果集就是区间向量,可以通过[]指定时间来做范围查询,查询5分钟内的Gc累积消耗时间:
go_gc_duration_seconds_count{}[5m]
注意:这里范围查询第一个点并不一定精确到刚刚好5分钟前的那个时序样本点,他是以5分钟作为一个区间,寻找这个区间的第一个点到最后一个样本点。
 时间单位:
时间单位:
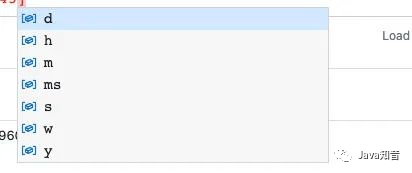
d:天,h:小时,m:分钟,ms:毫秒,s:秒,w:周,y:年
同样支持类似SQL中的offset查询,如下:查询一天前当前5分钟前的时序数据集:
go_gc_duration_seconds_count{}[5m] offset 1d
(三)内置函数
Prometheus内置了很多函数,这里主要记录下常用的几个函数的使用:
rate和irate函数:rate函数可以用来求指标的平均变化速率
rate函数=时间区间前后两个点的差 / 时间范围
一般rate函数可以用来求某个时间区间内的请求速率,也就是我们常说的QPS
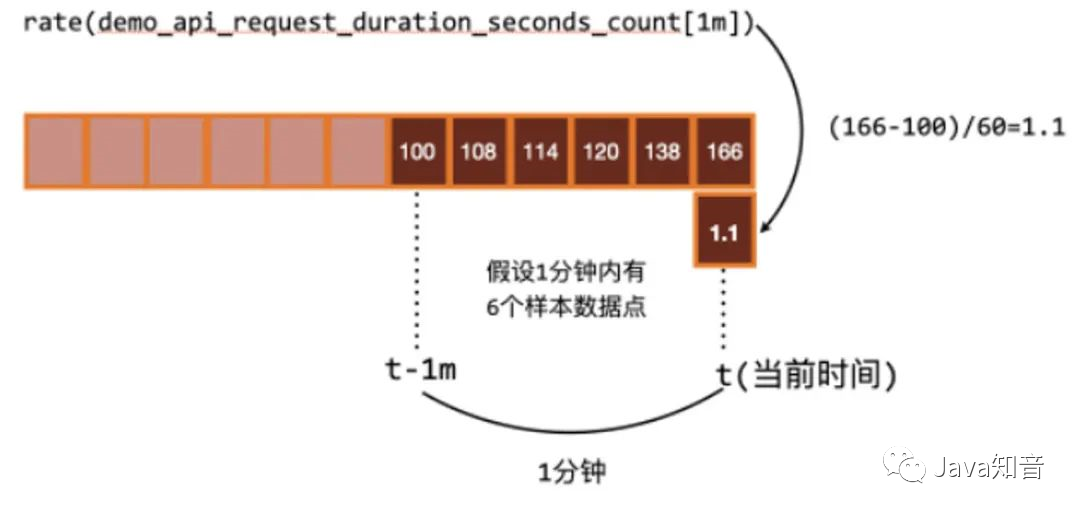 但是rate函数只是算出来了某个时间区间内的平均速率,没办法反映突发变化,假设在一分钟的时间区间里,前50秒的请求量都是0到10左右,但是最后10秒的请求量暴增到100以上,这时候算出来的值可能无法很好的反映这个峰值变化。
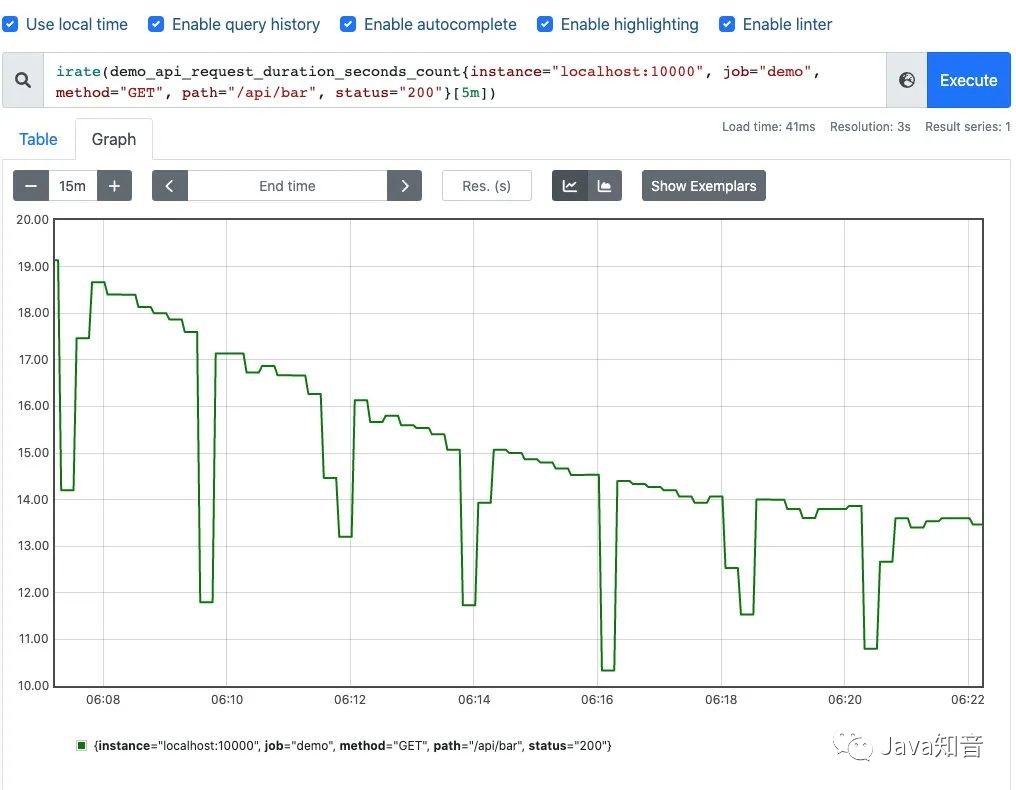
这个问题可以通过irate函数解决,irate函数求出来的就是瞬时变化率。
时间区间内最后两个样本点的差 / 最后两个样本点的时间差
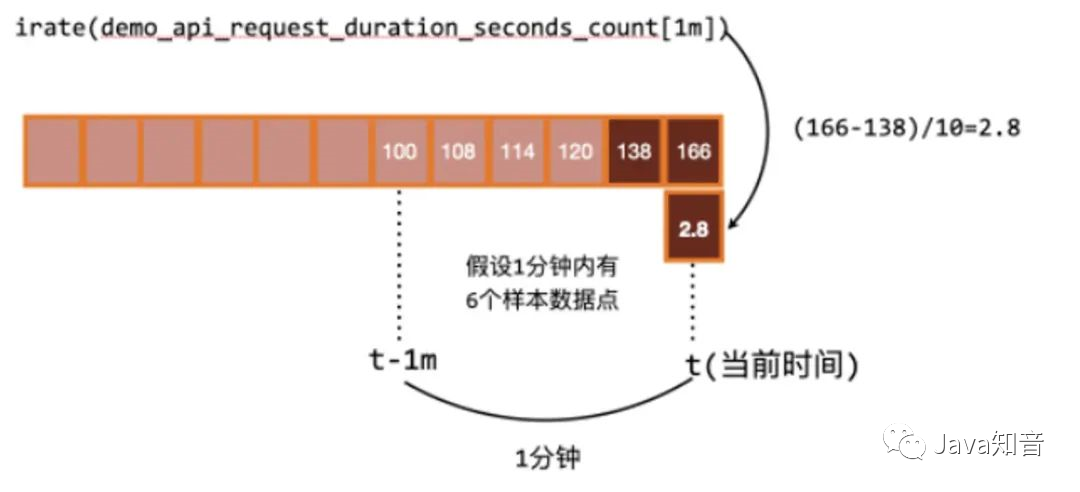
可以通过图像看下两者的区别:irate函数的图像峰值变化大,rate函数变化较为平缓。
rate函数
irate函数
聚合函数:Sum() by() without()
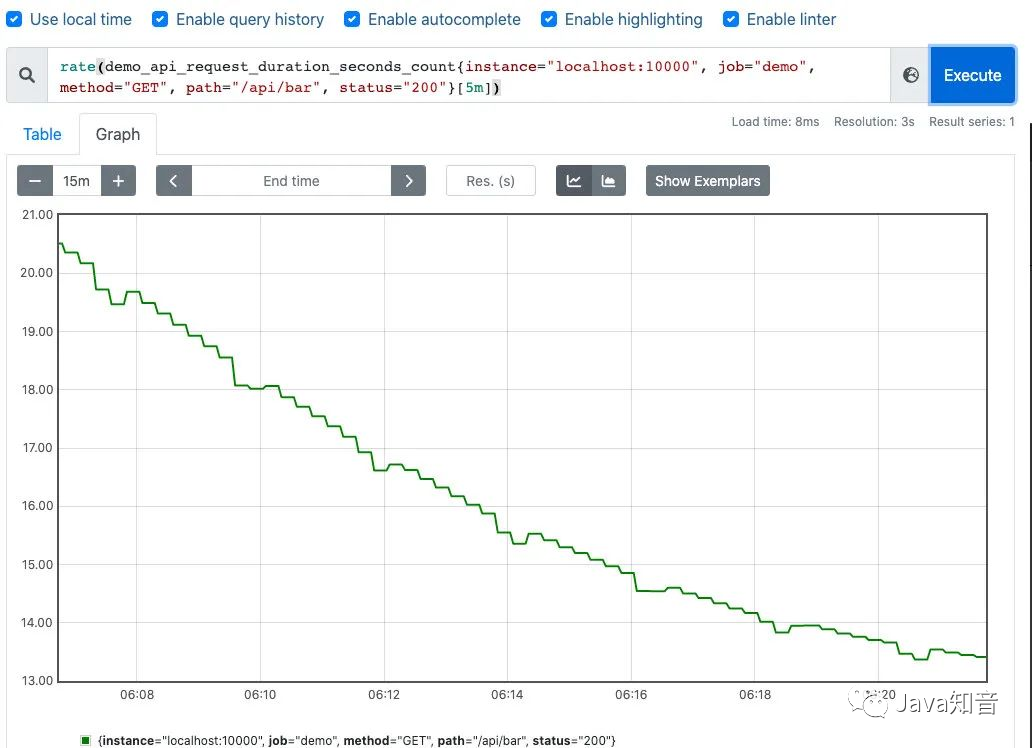
也是上边的例子,我们在求指定接口的QPS的时候,可能会出现多个实例的QPS的计算结果,如下是存在多个接口,三个服务的QPS。
rate(demo_api_request_duration_seconds_count{job="demo", method="GET", status="200"}[5m])
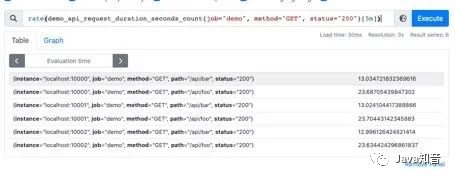 利用sum函数可以将三个QPS聚合,即可得到整个服务该接口的QPS:其实Sum就是将指标值做相加。
 但是这样直接的相加太笼统抽象了,可以配合by和without函数在sum的时候,基于某些标签分组,类似SQL中的
group by
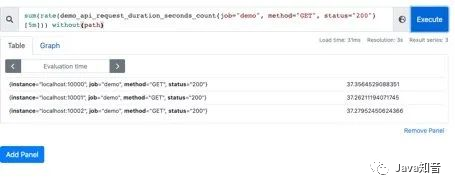
例如,我可以根据请求接口标签分组:这样拿到的就是具体接口的QPS:
sum(rate(demo_api_request_duration_seconds_count{job="demo", method="GET", status="200"}[5m])) by(path)
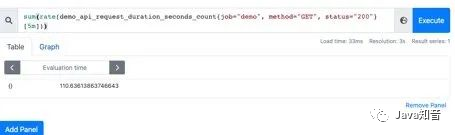
 也可以不根据接口路径分组:通过without指定:
sum(rate(demo_api_request_duration_seconds_count{job="demo", method="GET", status="200"}[5m])) without(path)
 可以通过
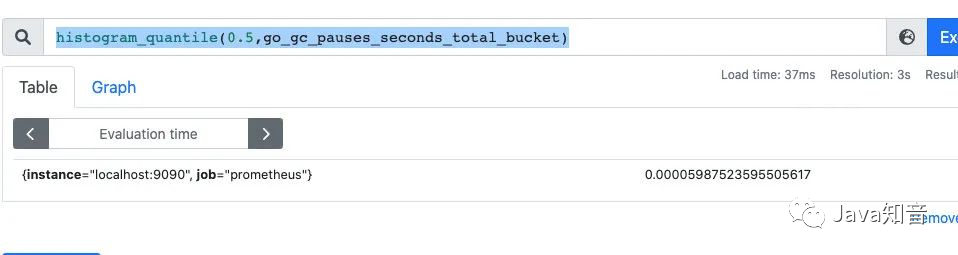
可以通过histogram_quantile函数做数据统计:可以用来统计百分位数:第一个参数是百分位,第二个histogram指标,这样计算出来的就是中位数,即P50
histogram_quantile(0.5,go_gc_pauses_seconds_total_bucket)
分享之前和同事一起发现的坑:
在刚刚写的自定义exporter上新增几个histogram的样本点:
MyHistogram.Observe(0.3)
MyHistogram.Observe(0.4)
MyHistogram.Observe(0.5)
histogram的桶设置:
MyHistogram = prometheus.NewHistogram(prometheus.HistogramOpts{
   Name: "my_histogram_bucket",
   Help: "自定义histogram",
   Buckets: []float64{0,2.5,5,7.5,10},    // 需要指定桶
})
如果这样的话,所有指标都会直接进入到第一个桶,即0到2.5这个桶,如果我要计算中位数,那么这个中位数按照数学公式来算的话,肯定是在0到2.之间的,而且肯定是0.3到0.5之间。
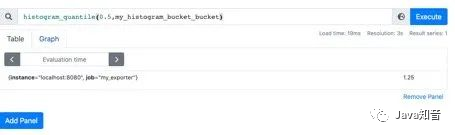
我用histogram_quantile函数计算下:计算结果是1.25,其实已经不对了。
histogram_quantile(0.5,my_histogram_bucket_bucket)
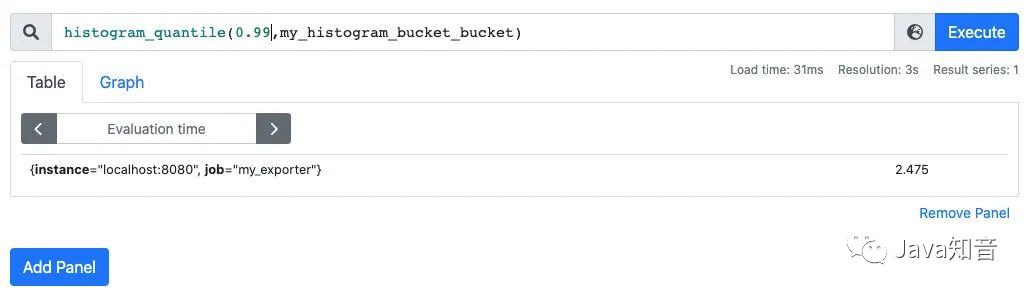
 我在计算下P99,等于2.475:
histogram_quantile(0.99,my_histogram_bucket_bucket)
 我的指标都是不大于1的,为啥算出来的P50和P99都这么离谱呢?
这是因为Prometheus他是不保存你具体的指标数值的,他会帮你把指标放到具体的桶,但是他不会保存你指标的值,计算的分位数是一个预估的值,怎么预估呢?
就是假设每个桶内的样本分布是均匀的,线性分布来计算的,比如刚刚的P50,其实就是算排在第50%位置的样本值,因为刚刚所有的数据都落在了第一个桶,那么他在计算的时候就会假定这个50%值在第一个桶的中点,他就会假定这个数就是0.5_ 2.5,P99就是第一个桶的99%的位置,他就会假定这个数就是0.99 _ 2.5。
导致这个误差较大的原因就是我们的bucket设置的不合理。
重新定义桶:
// 定义histogram
MyHistogram = prometheus.NewHistogram(prometheus.HistogramOpts{
   Name: "my_histogram_bucket",
   Help: "自定义histogram",
   Buckets: []float64{0.1,0.2,0.3,0.4,0.5},   // 需要指定桶
})
上报数据:
MyHistogram.Observe(0.1)
MyHistogram.Observe(0.3)
MyHistogram.Observe(0.4)
 重新计算 P50,P99:

 桶设置的越合理,计算的误差越小。
六、Grafana可视化
除了可以利用Prometheus提供的webUI可视化我们的指标外,还可以接入Grafana来做指标的可视化。
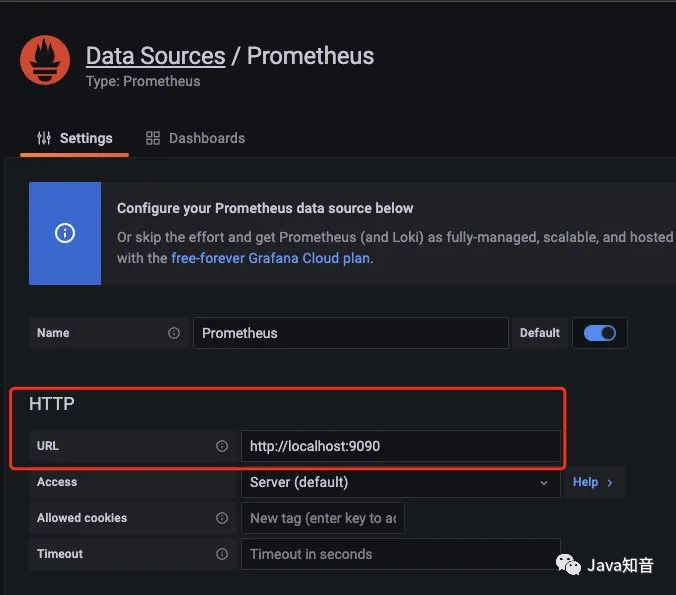
第一步,对接数据源:
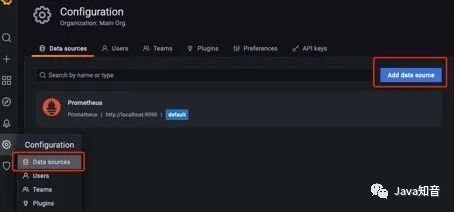 配置好
配置好prometheus的地址:
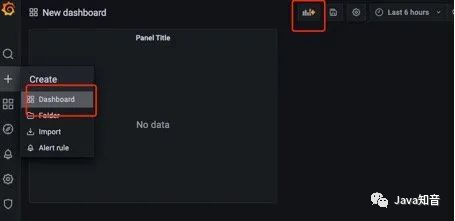
第二步:创建仪表盘
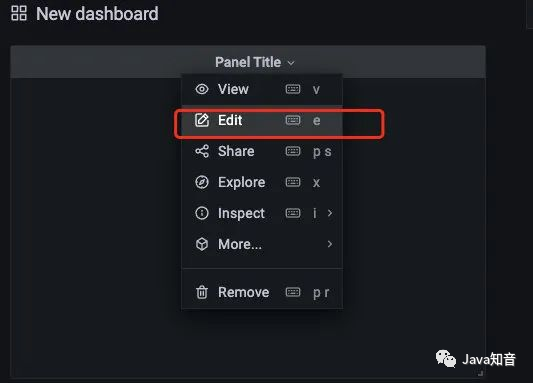
 编辑仪表盘:
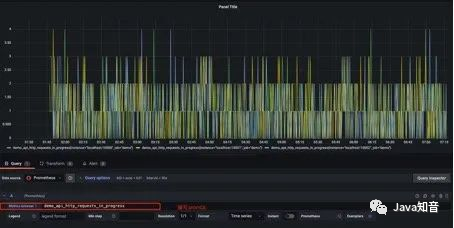
 在
在metrics处编写PromQL即可完成查询和可视化:
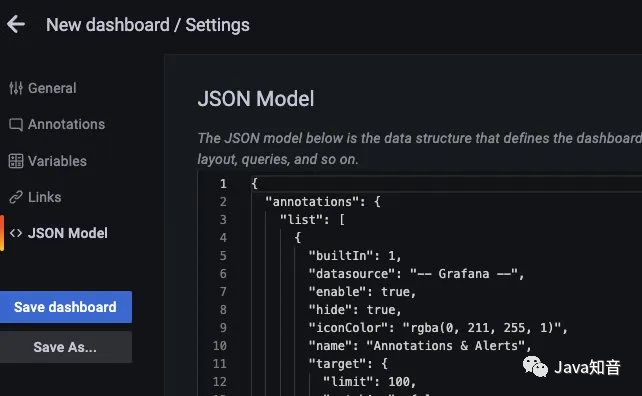
 仪表盘编辑完后,可以导出对应的 json 文件,方便下次导入同样的仪表盘:
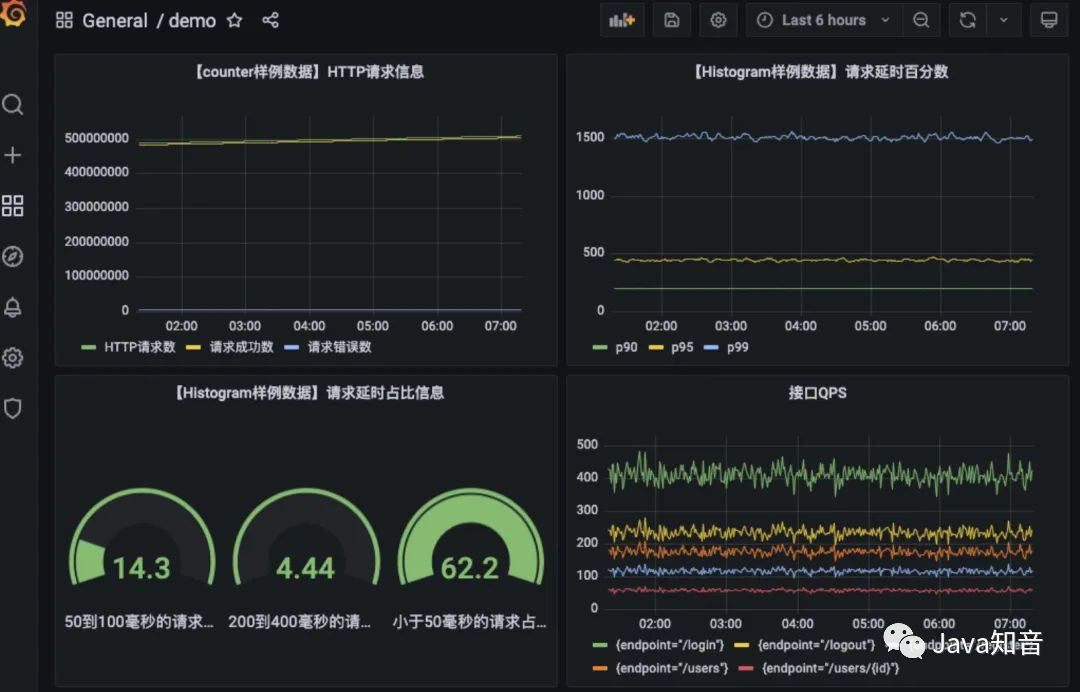
 以上是我之前搭建的仪表盘:
七、监控告警
AlertManager是prometheus提供的告警信息下发组件,包含了对告警信息的分组,下发,静默等策略。配置完成后可以在webui上看到对应的告警策略信息。告警规则也是基于PromQL进行定制的。
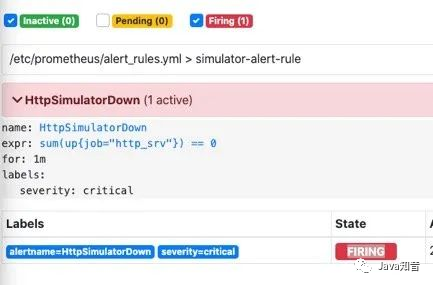
编写告警配置:当Http_srv这个服务挂了,Prometheus采集不到指标,并且持续时间1分钟,就会触发告警
groups:
- name: simulator-alert-rule
  rules:
  - alert: HttpSimulatorDown
    expr: sum(up{job="http_srv"}) == 0
    for: 1m
    labels:
      severity: critical
在prometheus.yml中配置告警配置文件,需要配置上alertmanager的地址和告警文件的地址
# Alertmanager configuration
alerting:
  alertmanagers:
  - static_configs:
    - targets: ['localhost:9093']
# Load rules once and periodically evaluate them according to the global 'evaluation_interval'.
rule_files:
    - "alert_rules.yml"
    #- "first_rules.yml"
配置告警信息,例如告警发送地址,告警内容模版,分组策略等都在alertmanager的配置文件中配置:
global:
  smtp_smarthost: 'smtp.qq.com:465'
  smtp_from: '[email protected]'
  smtp_auth_username: '[email protected]'
  smtp_auth_password: 'xxxx'
  smtp_require_tls: false

route:
  group_interval: 1m
  repeat_interval: 1m
  receiver: 'mail-receiver'

#  group_by             //采用哪个标签作为分组
#  group_wait           //分组等待的时间,收到报警不是立马发送出去,而是等待一段时间,看看同一组中是否有其他报警,如果有一并发送
#  group_interval       //告警时间间隔
#  repeat_interval      //重复告警时间间隔,可以减少发送告警的频率
#  receiver             //接收者是谁
#  routes               //子路由配置
receivers:
- name: 'mail-receiver'
  email_configs:
    - to: '[email protected]'
当我kill进程:
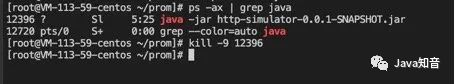
prometheus已经触发告警:
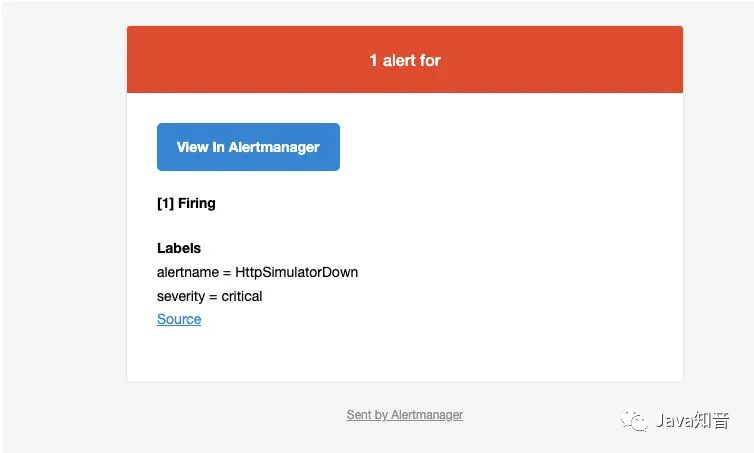
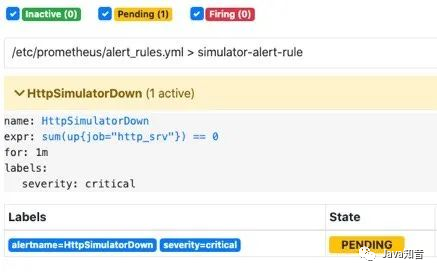 在等待1分钟,如果持续还是符合告警策略,则状态为从
pending变为FIRING会发送邮件到我的邮箱
 此时我的邮箱收到了一条告警消息:
alertmanager也支持对告警进行静默,在alertmanager的WEBUI中配置即可:
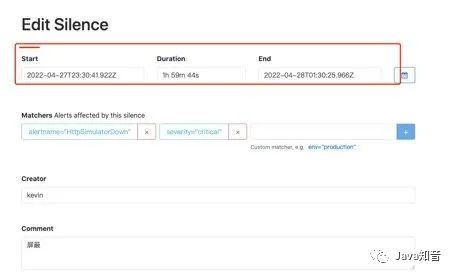 间隔了4分钟,没有收到告警,静默生效:
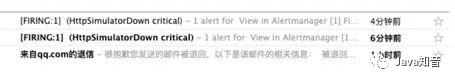 一个小时没有收到告警信息:

参考资料:
-
Pull or Push?监控系统如何选型-阿里云开发者社区 -
为go应用添加prometheus监控指标-SegmentFault思否 -
GitHub-prometheus/client_golang -
Material for MkDocs - Prometheus入门到实战 -
Finally someone explained how to get started with Prometheus - DockOne.io -
Prometheus alarm AlertManager actual combat -
How to hot load new configuration Prometheus combat -
https://www.youtube.com/watch?v=qB40kqhTyYM&t=2261s -
https://www.youtube.com/watch?v=SOTxSSiLtuA&t=141s
-End-
Recently, some friends asked me to help me find some interview question materials, so I rummaged through the 5T materials in my collection, and sorted them out. It can be said that it is a must for programmer interviews! All the information is organized into the network disk, welcome to download!
面试题] to get it